Are you ready to take your content marketing strategy to the next level? Knowing what works is crucial for achieving success. With this in mind, we’re arming you with 100+ content marketing statistics for 2023 that will help you familiarize yourself with trends that could make all the difference when it comes to your strategy.
From statistics about content marketing goals, towards content marketing tactics and formats to content writing statistics, this data offers insights into what successful digital markets are doing right now. It also provides predictions of where they might go next year.
Uncover the most up-to-date, current data around (no older than 2020) – no more outdated information thanks to our thorough research of dozens of sources. We’ve gathered only relevant and timely info so you can stay ahead in your field! You can find here content marketing stats from 2020, 2021, 2022, 2023, and 2024.
Note: If you're looking for AI Marketing Statistics go to our article:
Discover Key 2024 AI Marketing Statistics Now
Keep reading to learn everything you need to know!
Top B2B Content Marketing Statistics 2024
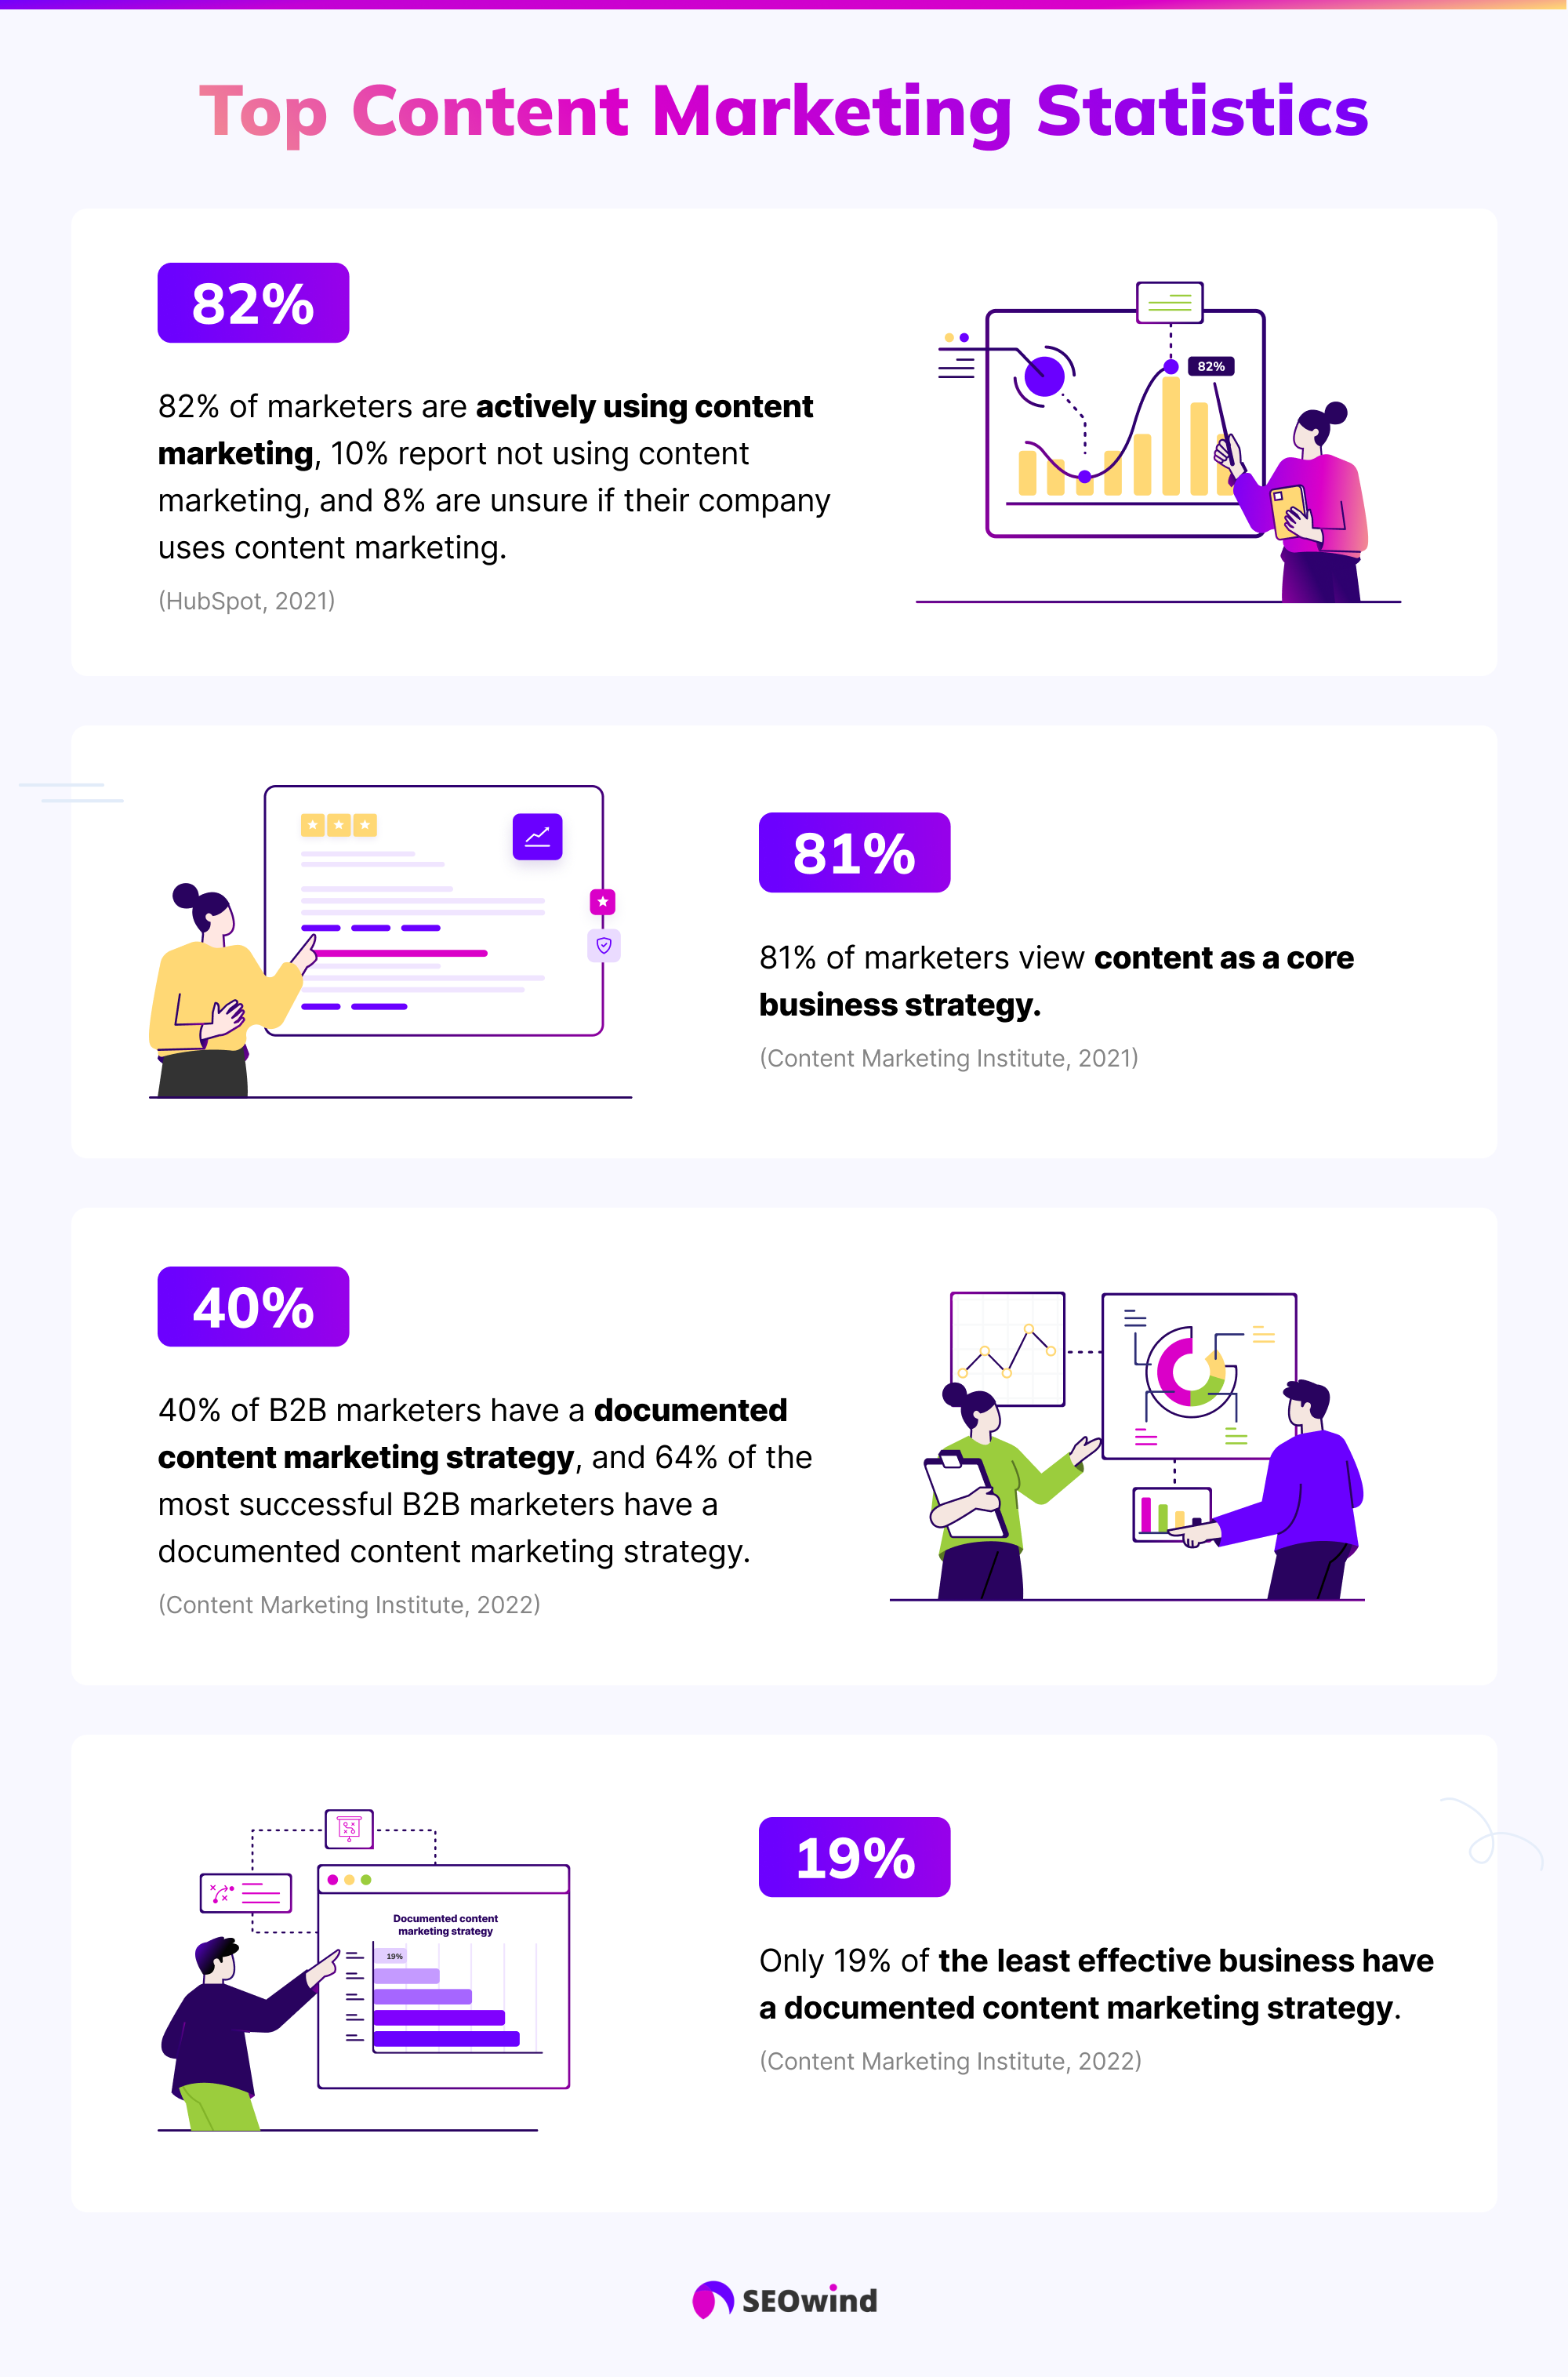
- 82% of marketers are actively using content marketing, 10% report not using content marketing, and 8% are unsure if their company uses content marketing (HubSpot, 2021)
- 40% of B2B marketers have a documented content marketing strategy, and 64% of the most successful B2B marketers have a documented content marketing strategy (Content Marketing Institute, 2022).
- 81% of the least effective businesses don’t have a recorded content marketing strategy, compared to 64% of top performers. (Content Marketing Institute, 2022)
- 81% of marketers view content as a core business strategy (Content Marketing Institute, 2021).
Content Marketing Strategy Statistics 2024
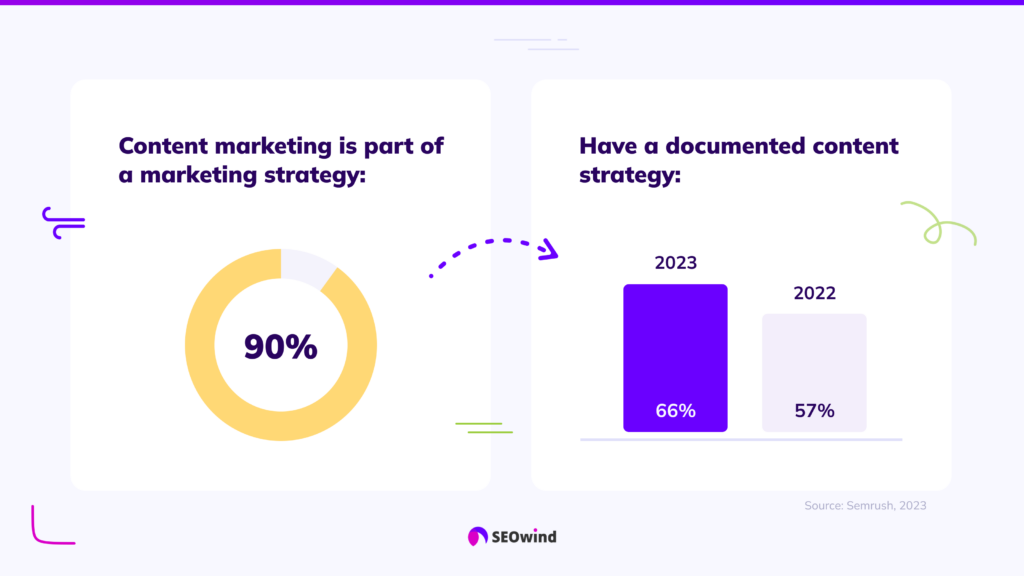
- 90% of our respondents say that content marketing is part of their marketing strategy, and 66% say this strategy is documented—that’s compared to 57% who documented their strategy in 2022. (Semrush, 2023)
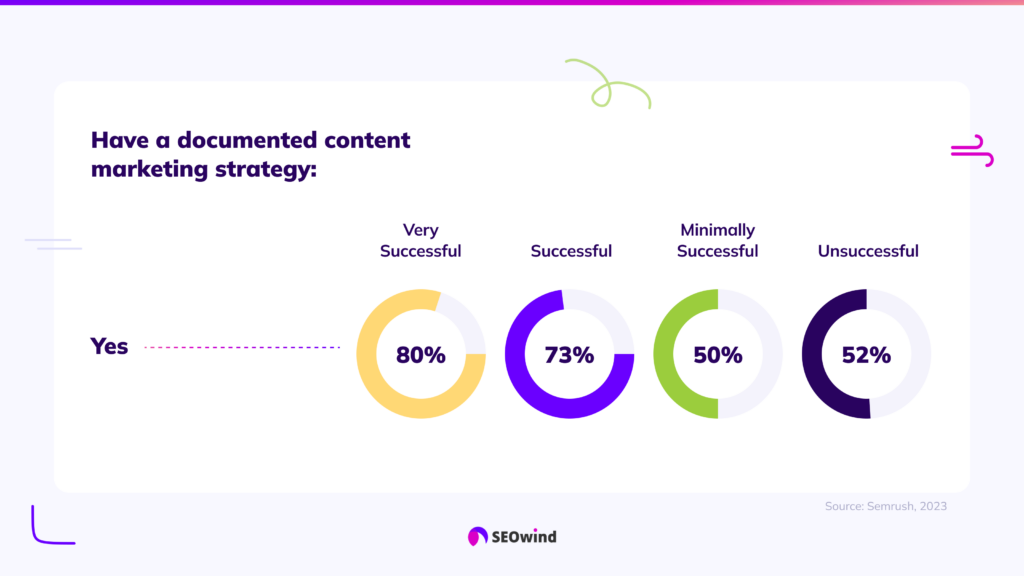
- 80% of those who considered themselves very successful in content marketing in 2022 have documented their content marketing strategies, as do 73% of content marketers who regard their efforts as successful. (Semrush, 2023)
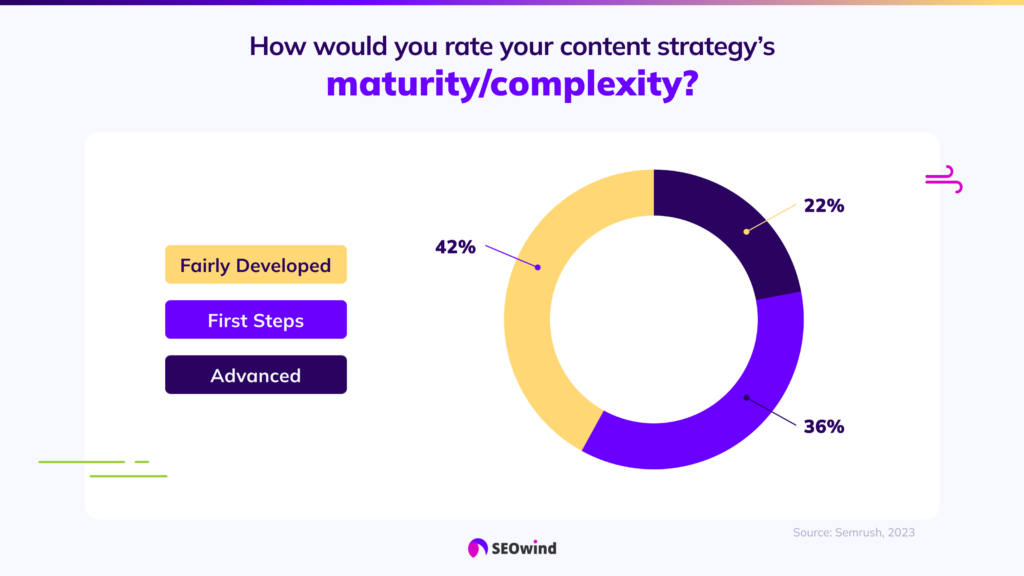
- 36% reported they are taking their first steps in content marketing, 42% of respondents claimed their strategy was fairly developed, whereas 22% reported an advanced content marketing strategy (Semrush, 2023)
Content Marketing Tactics Statistics 2024
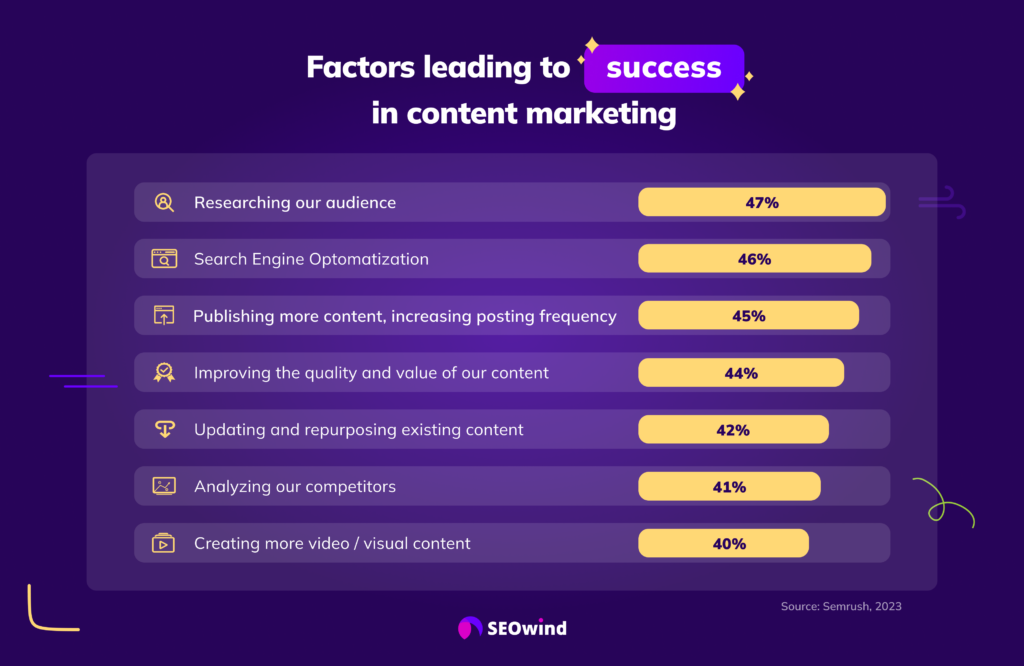
- In 2022, 47% of content marketers reported that researching their audience was the most important factor for content marketing success. 46% of those surveyed considered SEO as having the greatest impact, whereas 45% publishing more content. Updating and repurposing existing content was mentioned by 38% of respondents as a success factor. (Semrush, 2023)
- 83% of marketers say it’s better to focus on quality rather than quantity of content, even if it means posting less often (Hubspot, 2022)
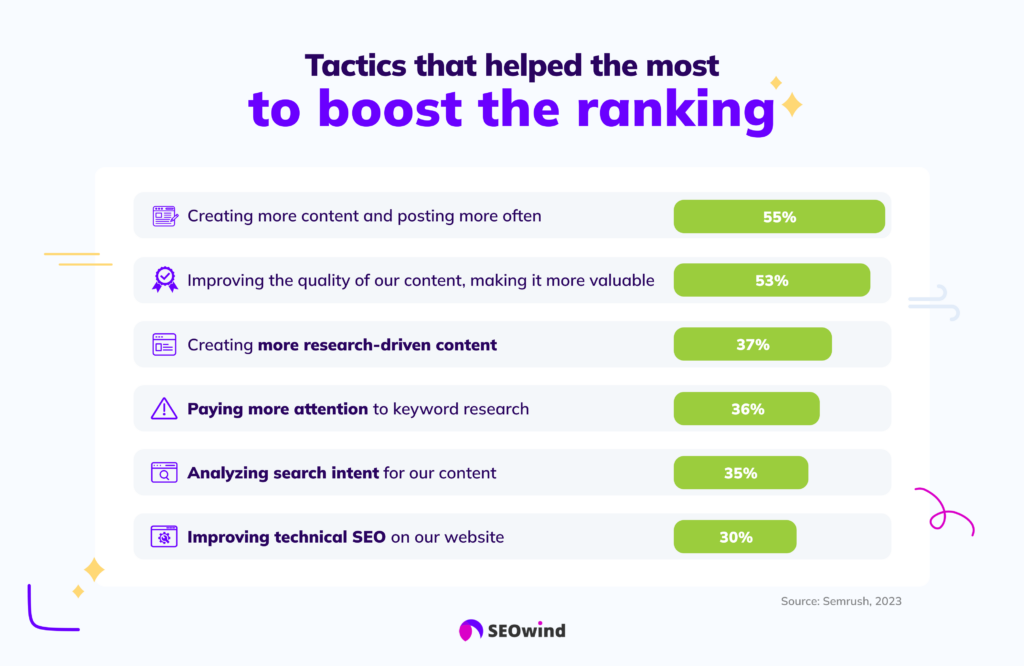
- 55% of marketers say creating more content and posting more often helped most with ranking their content organically. The second tactic that contributed to higher rankings was improving the quality of their content (53%), which was followed by creating more research-driven content (37%). Marketers reported also following tactics to contribute to boosting ranking: paying more attention to keyword research (36%), analyzing search intent for their content (35%), and improving technical SEO on their website (30%). (Semrush, 2023)
Content Marketing Goals Statistics 2024
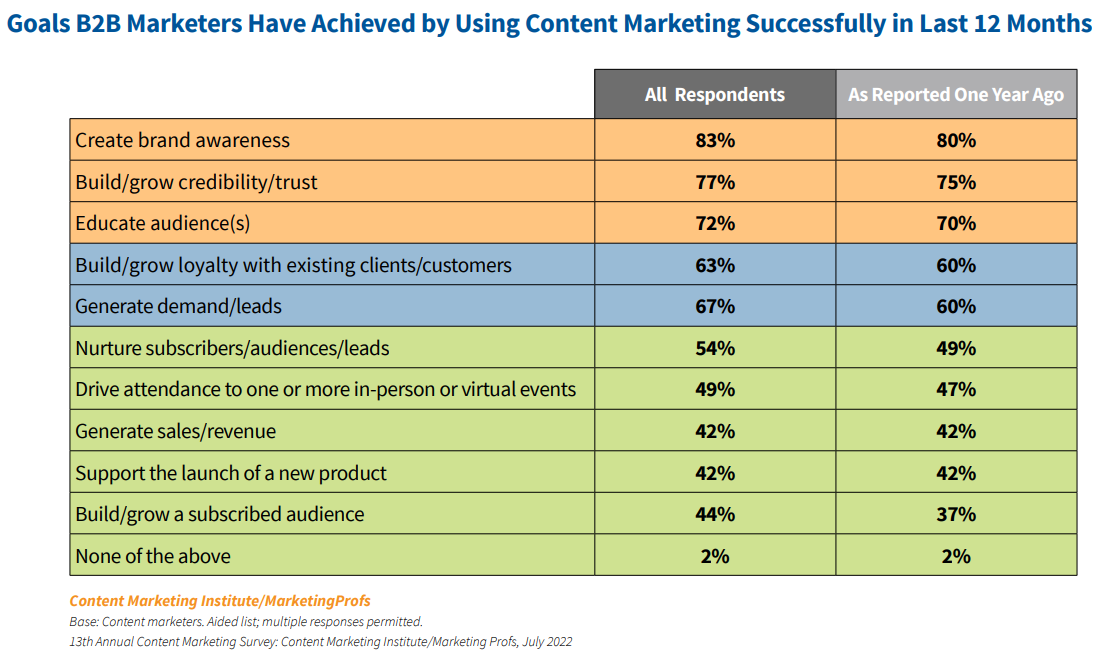
- Content marketing is a proven strategy for creating brand awareness, building trust, and educating audiences. 83% of marketers report that using content marketing in the last 12 months helped them create brand awareness (a 3% increase since last year), 77% build credibility and 72% educate the audience (2% increase each). Moreover, 67% of marketers report that content marketing generates demand/leads (a 7% increase since last year) and 63% say that it helps build loyalty with existing clients/customers (a 3% increase) (Content Marketing Institute, 2022)
Content Marketing Challenges 2024
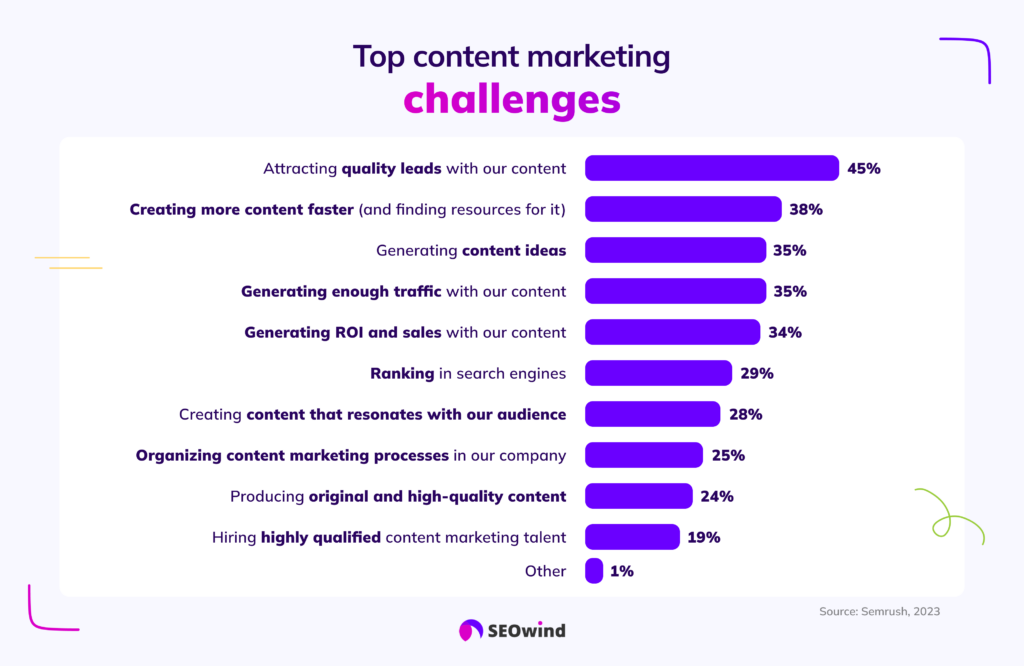
- 45% of respondents consider attracting quality leads with content as the main challenge in content marketing. Creating more content faster (and finding resources for it) is perceived as a challenge by 38% of research participants, and generating content ideas and generating enough traffic with the content by 35%. (Semrush, 2023)
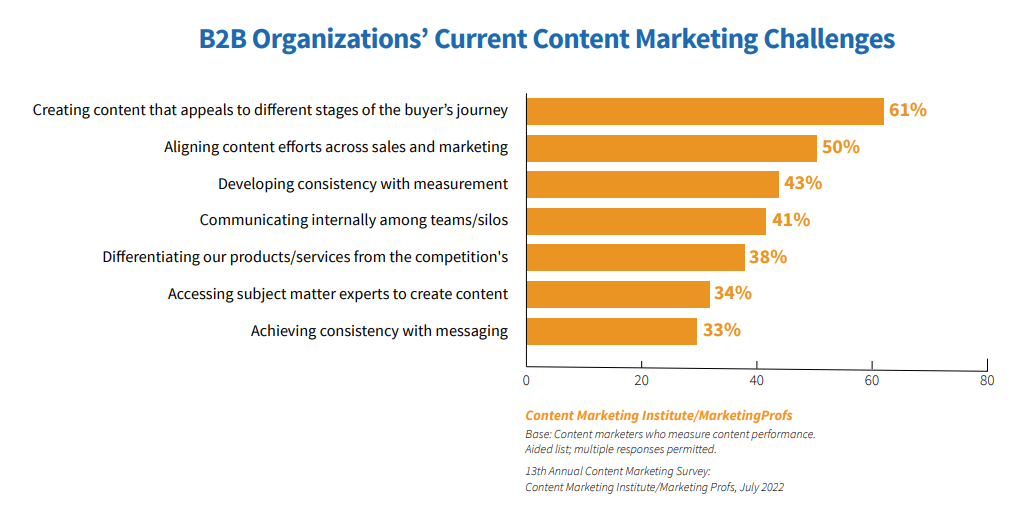
- Creating content that appeals to different stages of the buyer’s journey is named the top current content marketing challenge by 61% of respondents. 50% of research participants list aligning content efforts across sales and marketing and 43% developing consistency with measurement (Content Marketing Institute, 2022)
Content Marketing Budgets Statistics 2024
- 46% of businesses reported they want to increase their content creation spending by more than 9% in 2022. (Content Marketing Institute, 2022)
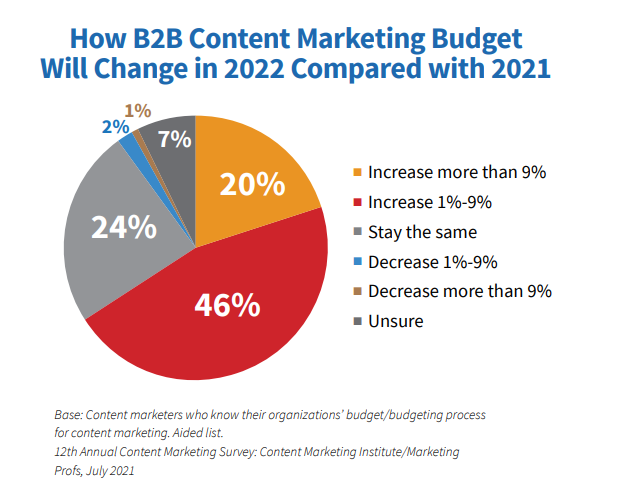
- During a late 2021 survey carried out among professionals involved in content marketing, 42 percent of respondents stated that they expected their content budgets to increase over the next year; 20 percent expected them to stay the same, and three percent to decrease. (Statista, 2023)
- During a global survey carried out in 2020, 37 percent of responding marketers said their company spent up to 10 thousand U.S. dollars that year on content marketing efforts. According to two percent of surveyed industry professionals, their content marketing budgets for 2020 ranged between 500 thousand and five million U.S. dollars. (Statista, 2023)
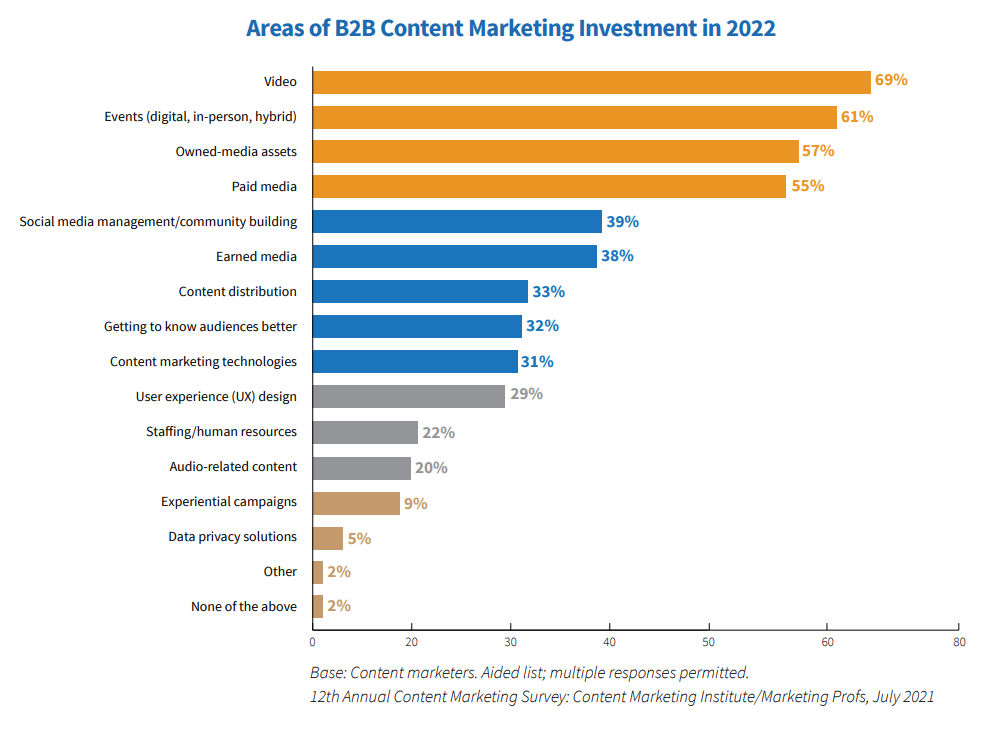
- The top five areas of investment for 2022 are video (69%), events (digital, in-person, hybrid) (61%), owned-media assets (57%), paid media (55%), and social media management /community-building (39%). (Content Marketing Institute, 2021)
Content Marketing Team Statistics 2024
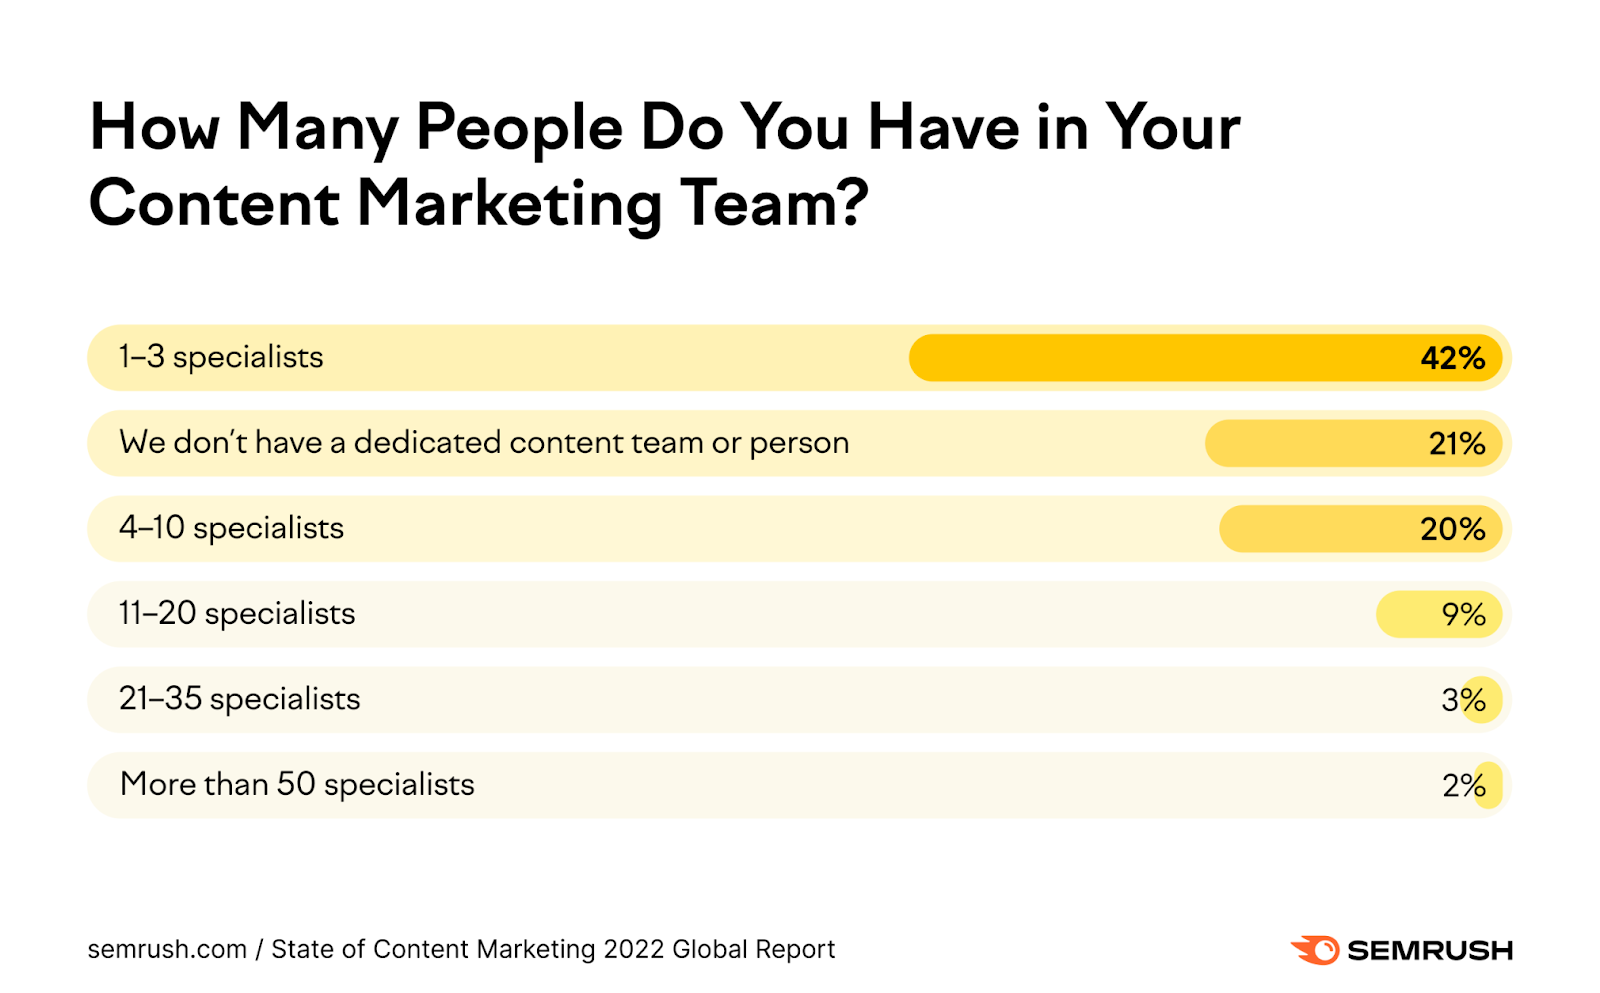
- 42% of companies have one to three specialists whereas 21% lack a content marketing person or team entirely.
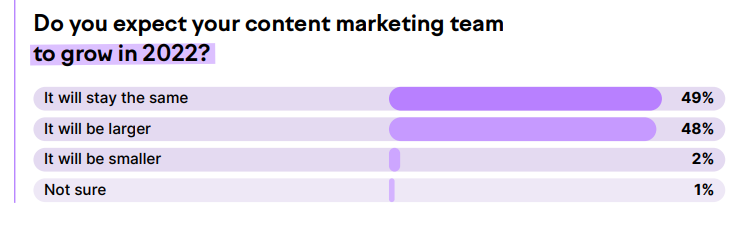
- 48% of companies were expected to grow their content team in 2022 (Semrush, 2022)
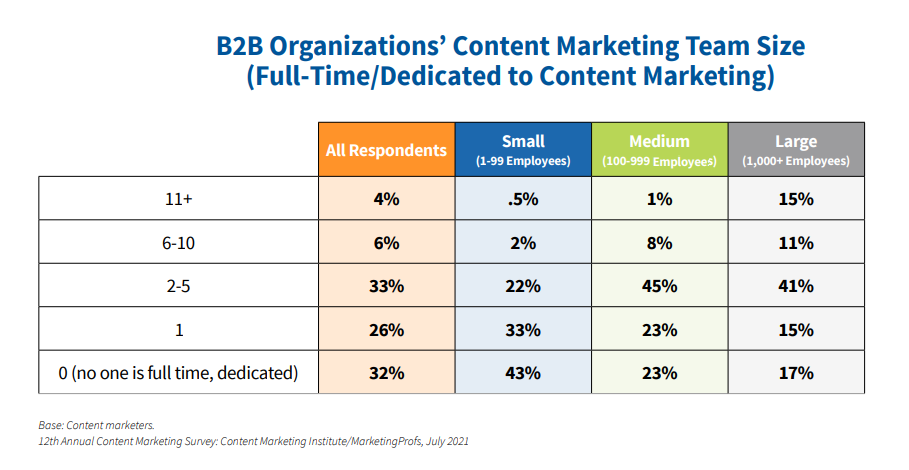
- 59% of companies reported having 1-5 employees dedicated to content marketing. Only 32% of B2B marketers said they didn’t have even one. (Content Marketing Institute, 2022)
Content Marketing Outsourcing Statistics 2024
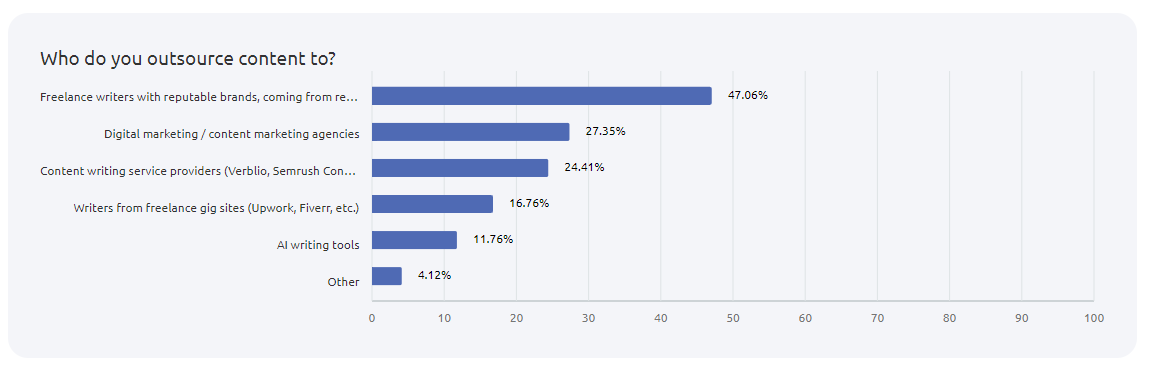
- Companies outsource to freelance writers with reputable brands coming from referrals (47%). Digital marketing and content marketing agencies are in second place, with a result of 27%. Content writing service providers came in third with a share of 24%. Freelancers that provide their writing services on popular gig sites are the choice of 17% of respondents, and AI writing tools are in last place, but with a noteworthy result of 12% of votes. (Semrush, 2021)
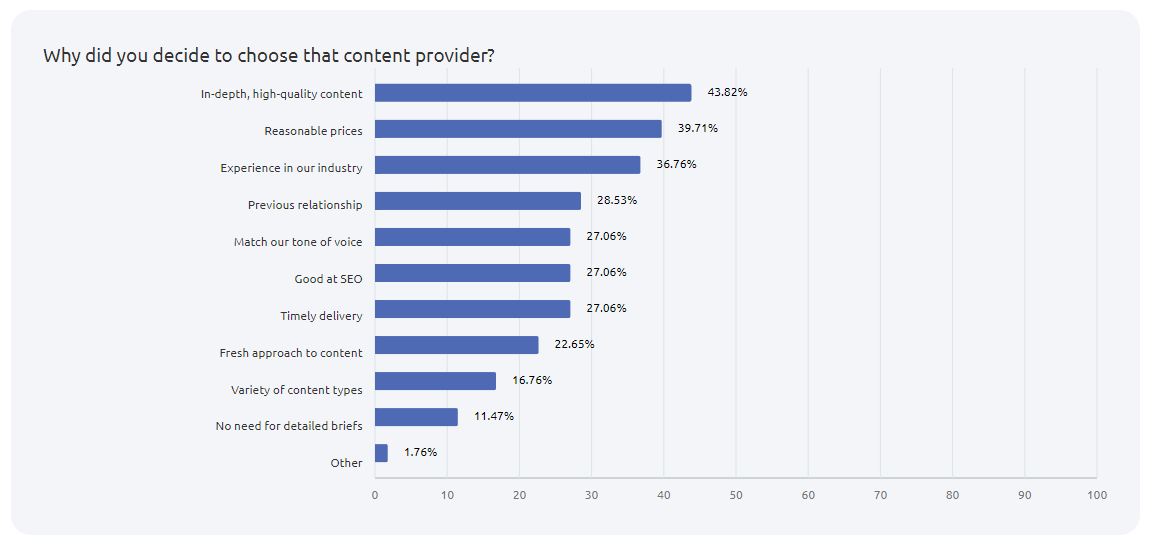
- When choosing a content provider, providing in-depth, high-quality content is the most important trait (44% of respondents). Reasonable prices also often prove to be a deciding factor (40% of respondents). The third place takes experience in the industry. (SEMrush, 2021).
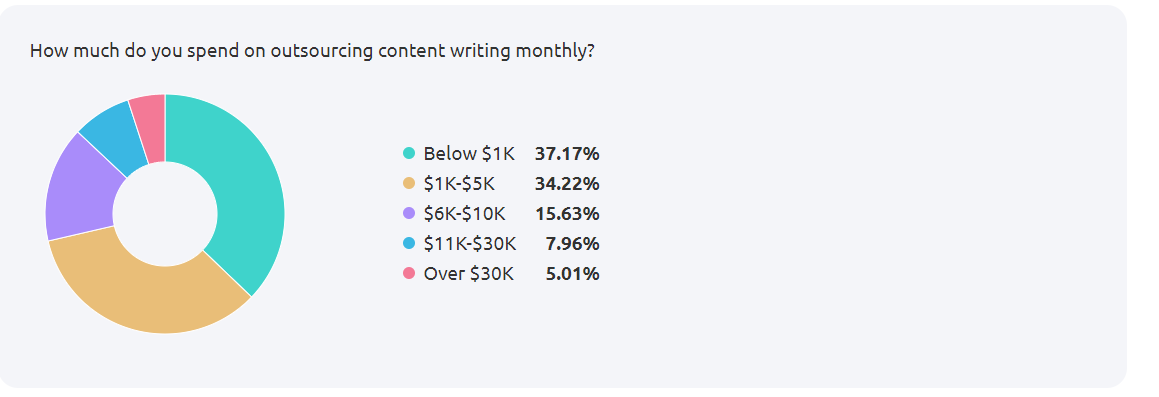
- How much do companies spend on outsourcing content writing monthly (Semrush, 2021)
When we look at how much different businesses spend on outsourcing, we find that the numbers run inversely to cost. Over half of the survey respondents spend $5,000 or less per month on external content writing, with 37.17% spending less than $1,000. Meanwhile, only 5.01% of companies allocated more than $30,000 monthly to such support.
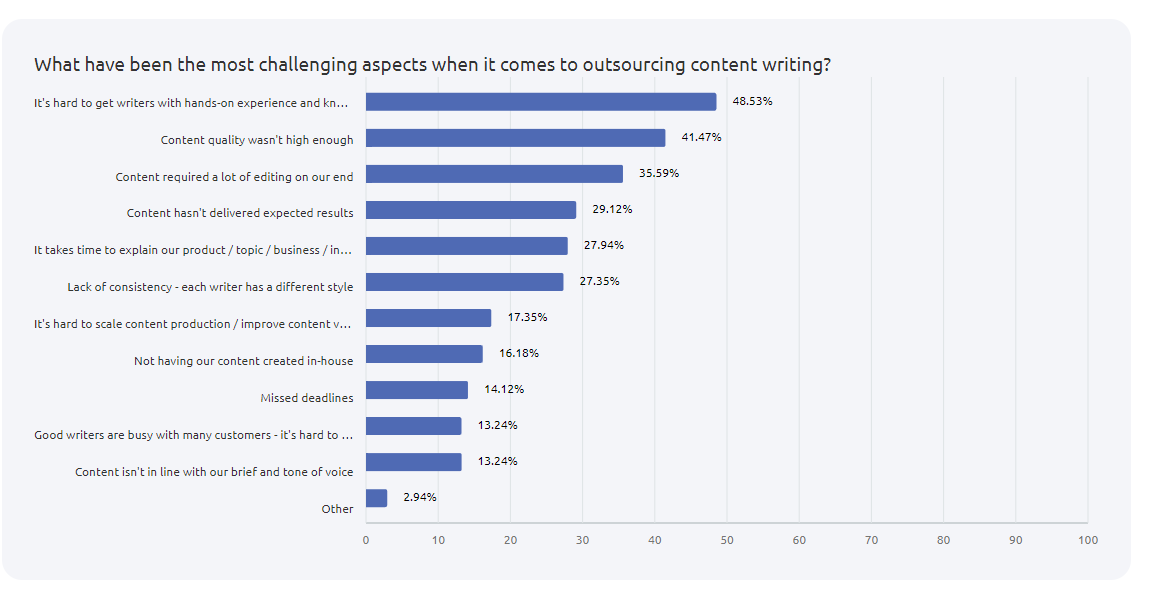
- Challenges with outsourcing content writing (Semrush, 2021)
As for the main hurdles with content writing outsourcing, it seems that experience and quality present the biggest issues. 48.53% of respondents report having difficulty finding writers with experience while 41.47% report insufficient writing quality. Meanwhile, the company’s own level of required effort has also proved a deterrent, with 35.59% unhappy with the amount of editing needed and 27.94% pointing to excessive explanation expectations.
- 75% of large companies outsource content marketing (Content Marketing Institute, 2021).
- About 50% of all B2B marketers said they outsource content marketing activities, and 65% said their biggest challenge is finding partners with adequate subject matter expertise. (Content Marketing Institute, 2021)
Content Formats and Content Types Statistics 2024
- The video was the primary form of content being created in 2022, followed by blogs (used by more than half of marketing teams), and images (HubSpot, 2022).
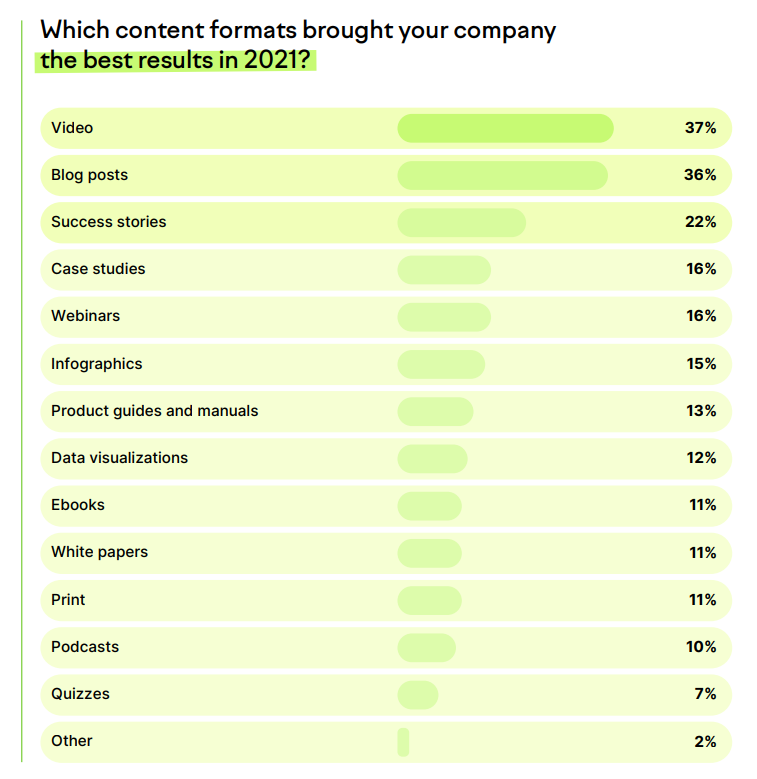
- Content formats/types that brought your company the best results (Semrush, 2022)
There is a noted disparity in the expected value delivered by different forms of content. Videos and blog posts proved the most useful for 37% and 36% of companies, respectively. While success stories offered the best results for 22% of respondents, no other format type was reported as most valuable by more than 16% of organizations.
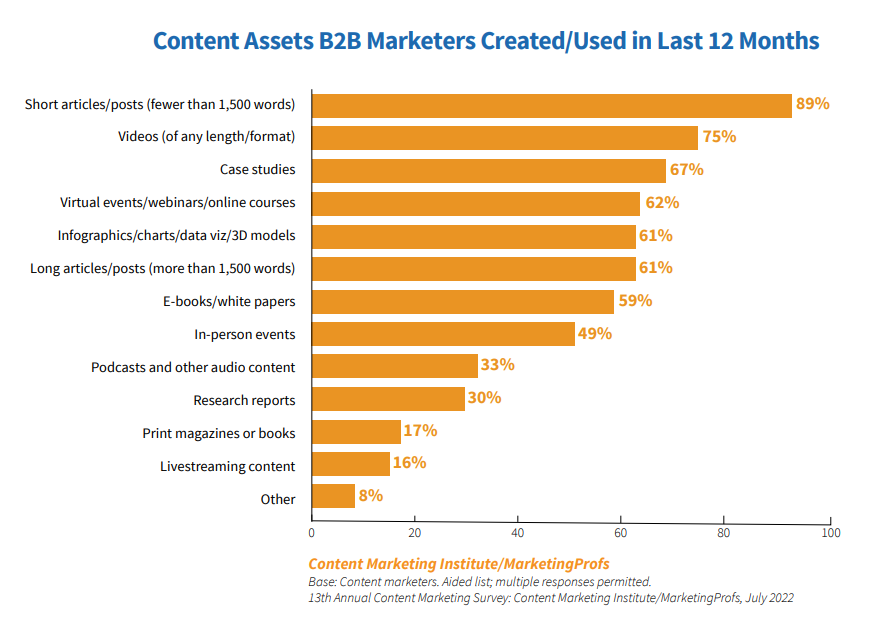
- Content Assets B2B Marketers Created (Content Marketing Institute, 2022)
The value indicated above is further represented in the rates at which marketers are creating and using content. Short articles and posts were the most common over the past year, with 89% of respondents reporting creation and use. Videos are also in high demand (75% of respondents), while case studies round out the top three (67%).
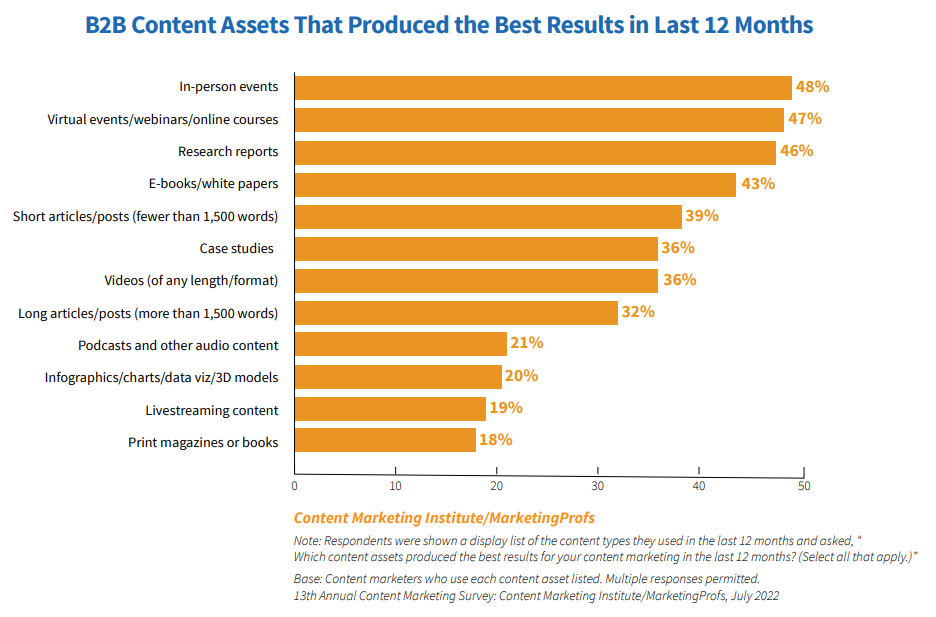
- B2B Content Assets That Produced the Best Results in the Last 12 Months (Content Marketing Institute, 2022)
The impact of B2B content assets provides less clarity, with seven options delivering top results for 36-48% of respondents. Events scored high, with in-person gatherings reported as most valuable by 48% of businesses and digital options right behind at 47%. Research reports (43%) and e-books (43%) also broke the 40% threshold.
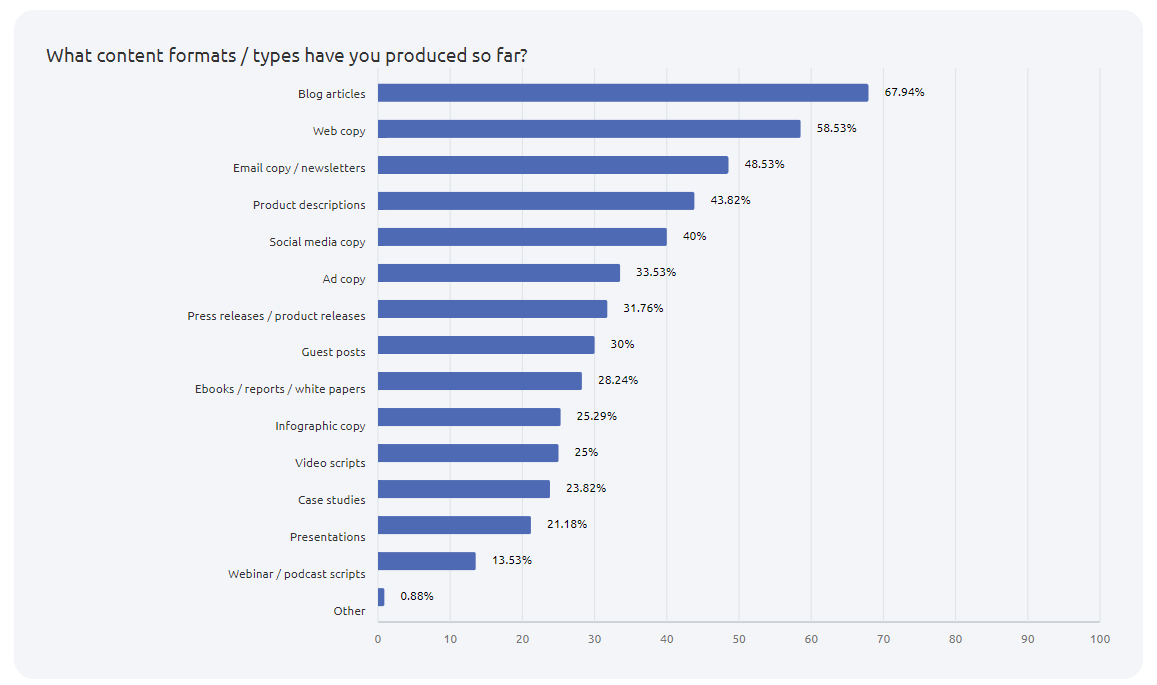
- What content formats/types have you produced so far (Semrush, 2021)
As for the content that companies have actually produced, most of the work has gone into written content. Blog articles (67.94%), web copies (58.53%), email copies (48.53%), and product descriptions (43.82%) are the most common among respondents. More design-related content such as video scripts and presentations, fall among the least common content that has been created.
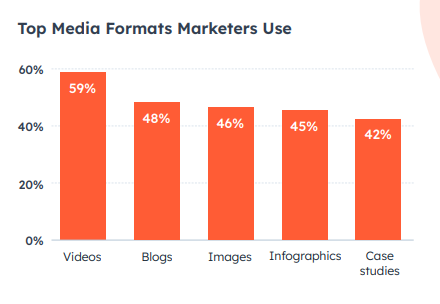
- Top media formats marketers use (HubSpot, 2022)
In keeping with other surveys considering usefulness, videos and blogs once again take the top spots in this HubSpot report. However, images, infographics, and case studies are all close in the overall frequency of use. Each of these five has clearly found a place among the regular tools that marketers are comfortable using.
Content Briefs Statistics 2024
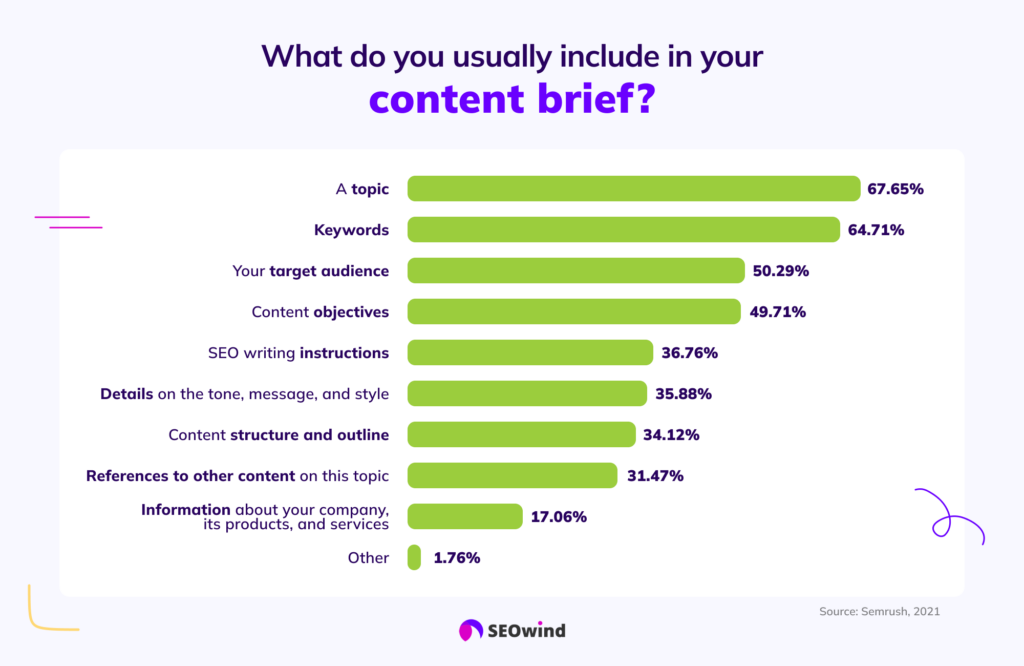
- What do marketers usually include in their content briefs (Semrush, 2021)
When SEMrush looked into the most common elements of content briefs, marketers most commonly indicated the inclusion of a topic (67.45%) and keywords (64.71%). As these are the most basic elements of copywriter and SEO activity respectively. The target audience (50.29%) and content objectives (49.71%) also show a high rate of use in copywriting briefs. SEO writing instruction are included by almost 37% of respondents.
Content Quality Statistics 2024
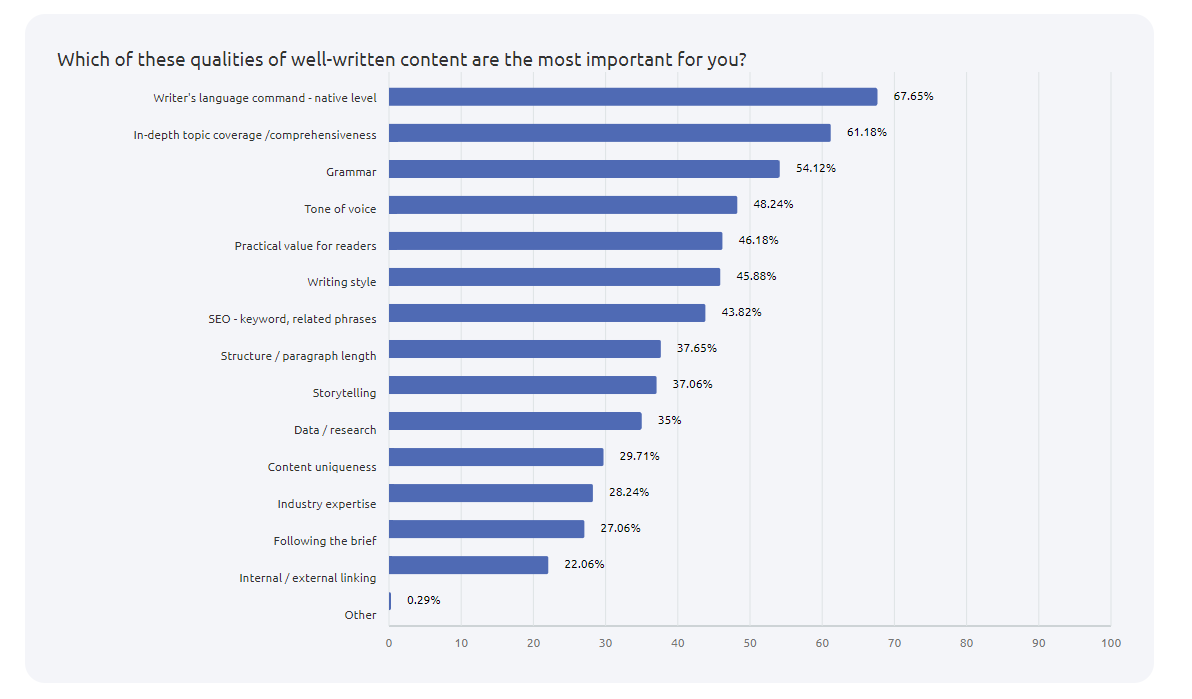
- Qualities of well-written content (Semrush, 2021)
The key ingredients to well-written content seem to be a native level of language ability and comprehensive topic coverage, which were selected by 67.65% and 61.18% of respondents respectively. Grammar (54.12%) clearly joins these two as a core pillar of good content as the only other option selected by over 50% of organizations.
Content Marketing Performance Metrics Statistics 2024
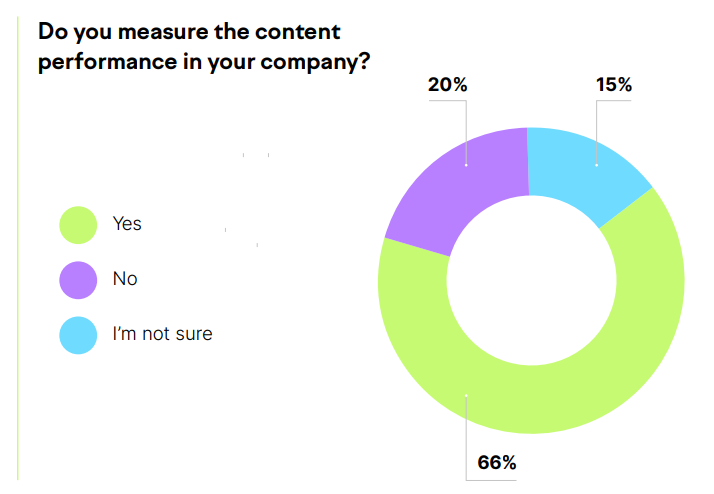
- 66% of companies measure content performance in some way, which leaves 20% of those who don’t and 15% who are not sure (Semrush, 2022)
- The top three content marketing metrics are organic traffic, search rankings, and leads. 51% of content marketers use organic traffic as a key metric for measuring content success, 42% search rankings, and 40% leads. Only 8% use backlinks. (Semrush, 2022)
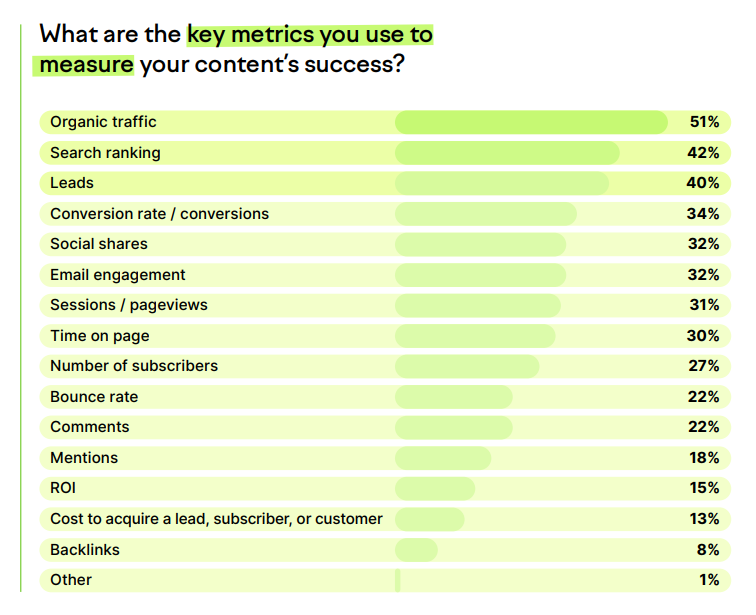
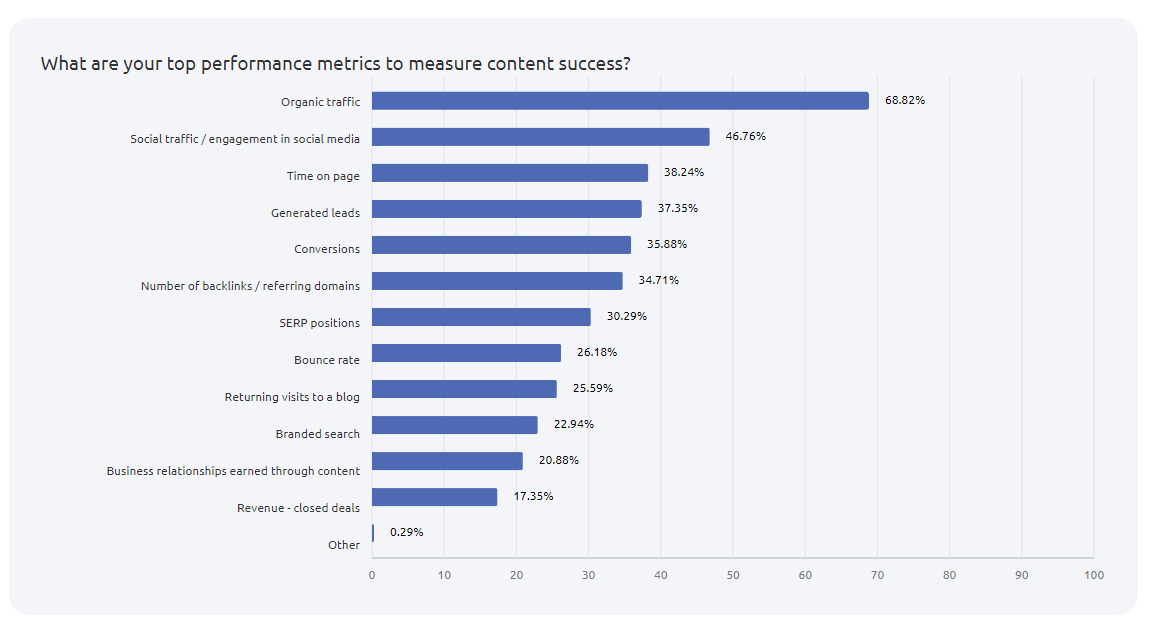
- What are your top metrics to measure content success (Semrush, 2022)
For effectively measuring the success of content, organic traffic (68.82%) and social traffic (46.76%) seem like the dominant options among respondents. Other important metrics such as time on page (38.24%), generated leads (37.35%), and conversions remain relevant, but to a lesser degree. Once businesses get beyond the most common options, there seems to be a great diversity of preferred metrics.
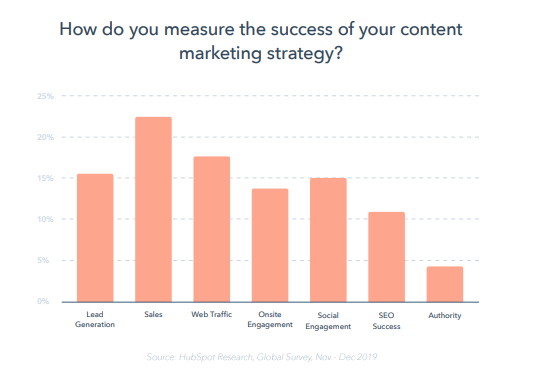
- How do you measure the success of your content marketing strategy (HubSpot, 2020)
While a HubSpot review from 2020 indicated that sales are the most frequently used indicator of content marketing success, they are far from alone. While no other option cracked the 20% threshold, four others were within 10% of the leader. Lead generation, web traffic, online engagement, and social engagement provide value to a wide variety of businesses.
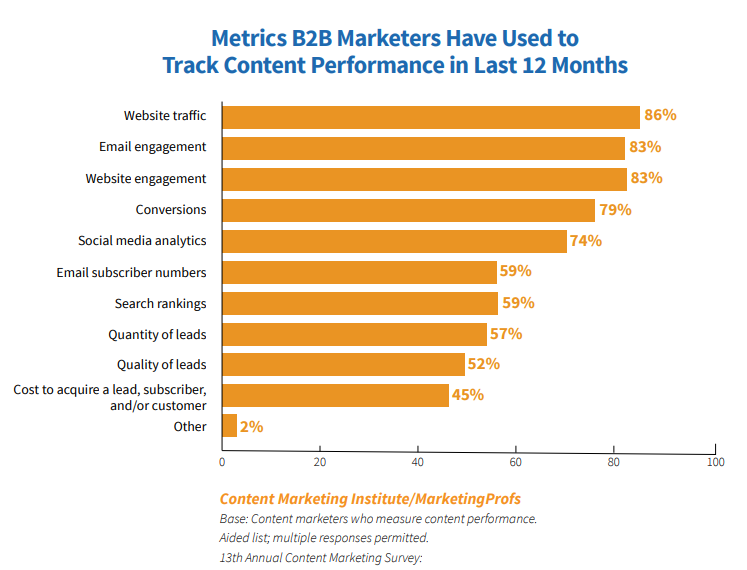
- Of marketers surveyed, 86% measure the success of their content based on website traffic, email engagement (83%), website engagement (83%), or conversions (79%). (Content Marketing Institute, 2022).
Content Audit Stats 2024
- 65% of companies that succeed in content marketing run content audits more than twice a year (Semrush, 2022)
- 46% of companies whose content marketing was unsuccessful in 2021 never run content audits (Semrush, 2022)
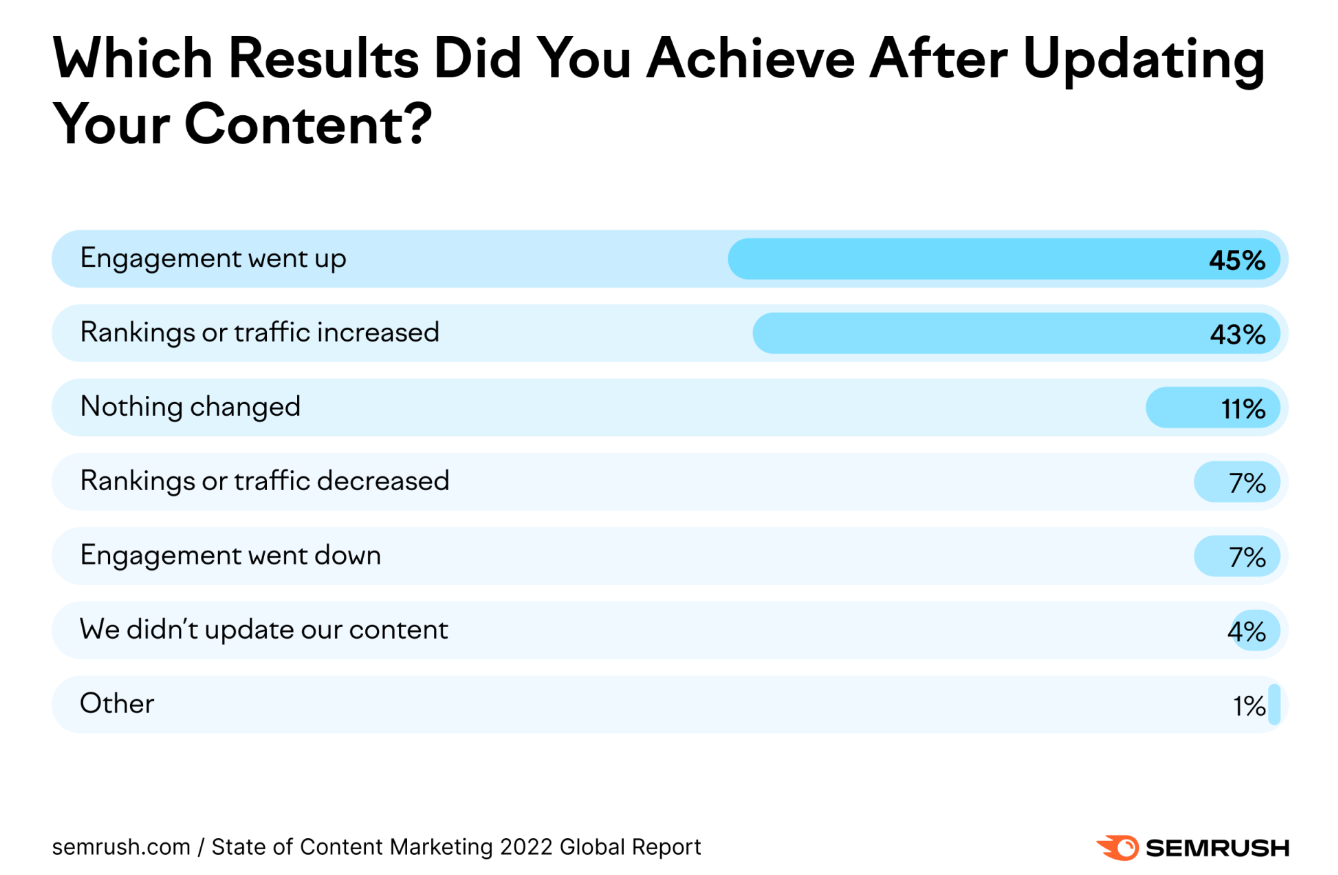
- Content Audit results
Following content updates, the vast majority of respondents to a recent SEMrush study indicated positive results. 45% indicated that overall engagement rose while 43% saw increased rankings or traffic. Only 11% indicated that nothing changed while even smaller numbers experienced a negative change, demonstrating the value of these updates. (Semrush, 2022)
Blogging and Blog Marketing Statistics 2024
- Short articles, less than 1,500 words, ranked 5th in the B2B content assets that generated the best results in the last 12 months. (Content Marketing Institute, 2022)
- 48% of companies that have a content marketing strategy leverage blogging. (HubSpot, 2022)

- There are 600,000,000 blogs on the internet today (WebsiteSetup.org, 2021)
- To date, there are more than 600 million blogs out of 1.9 billion websites in the world. Their authors account for over 6 million blog posts daily, or over 2.5 billion annually (Hosting Tribunal, 2022).
- WordPress users produce about 70 million new posts each month. (WordPress, 2022)
- 20 billion WordPress pages are viewed by over 409 million people each month. (WordPress, 2022)
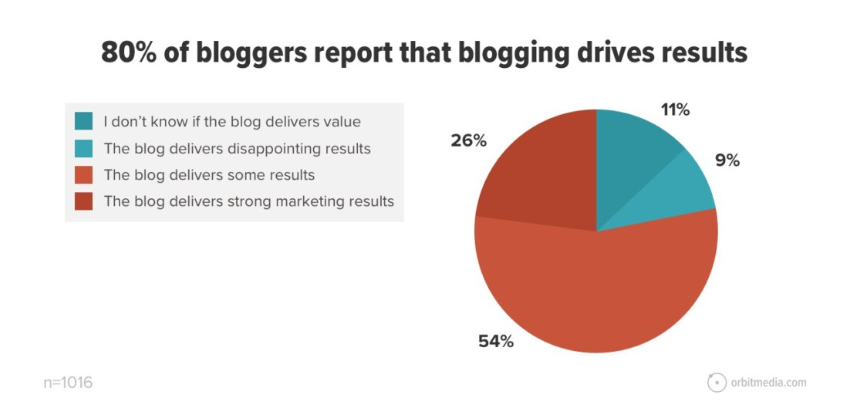
- 80% of surveyed bloggers report that their blog delivers “some results” or “strong results.” (Orbit Media, 2022)
- 26% of bloggers say that blogging drives strong marketing results for their business. (Orbit Media, 2022)
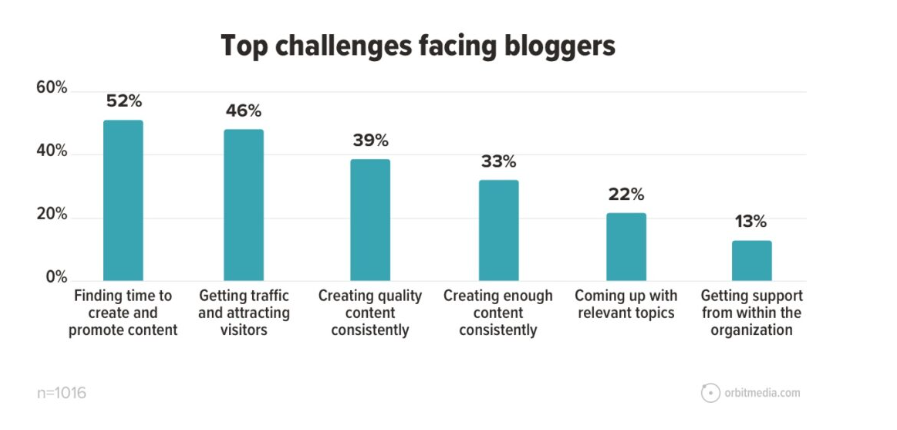
- The top challenge facing bloggers today is finding the time to create and promote content. (Orbit Media, 2022)
- The average blog post published in 2022 is 1376 words long. The bloggers who write 3000+ word articles are 2.5x as likely to report strong results. (Orbit Media, 2022)
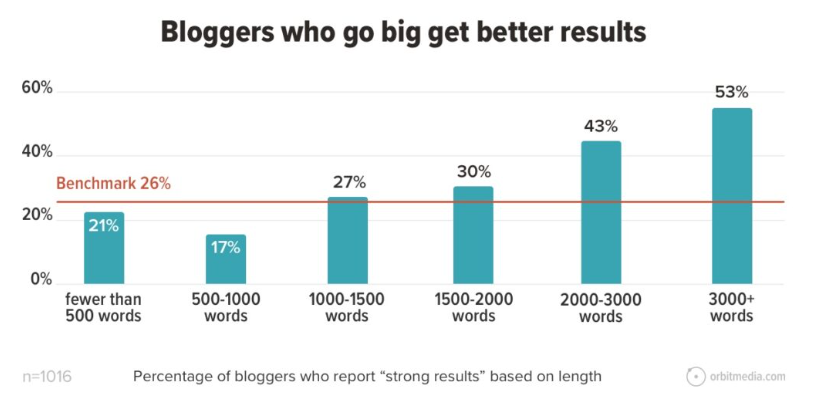
- The average blog length is 1376 words in 2022. (Orbit Media, 2022)
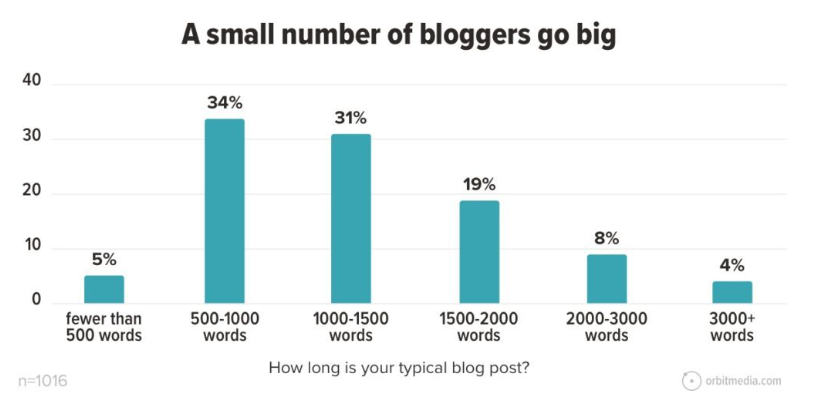
- While most bloggers produce articles in the 500 – 2000 word range, a small minority of just 4% of bloggers write long-form posts of 3000 words or more. (Orbit Media, 2022)
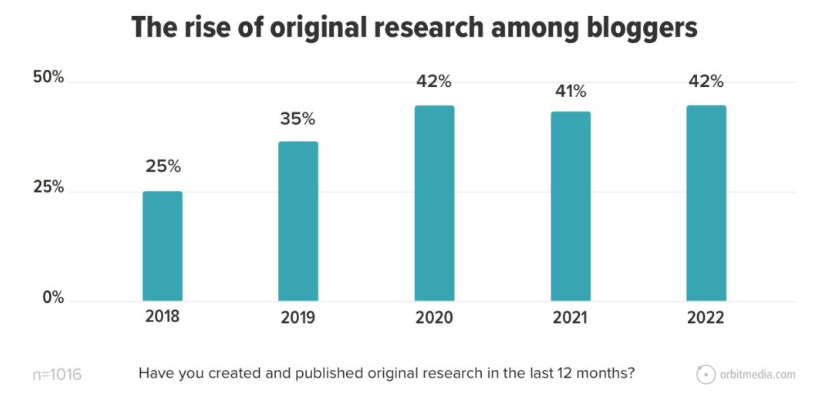
- 42% of bloggers create content around original research. Bloggers who conduct and publish original research are 41% more likely to report strong results. (Orbit Media, 2022)
- It takes an average of four hours and 10 minutes to write a blog post in 2022. 36% of bloggers who spend more than 6 hours on writing a post report “strong results.” (Orbit Media, 2022)
- The most popular blog content format is how-to articles (76%), followed by list-style posts (55%). The third place goes to Guides and eBooks (long form) and News and trends with 43% each (Orbit Media, 2022)
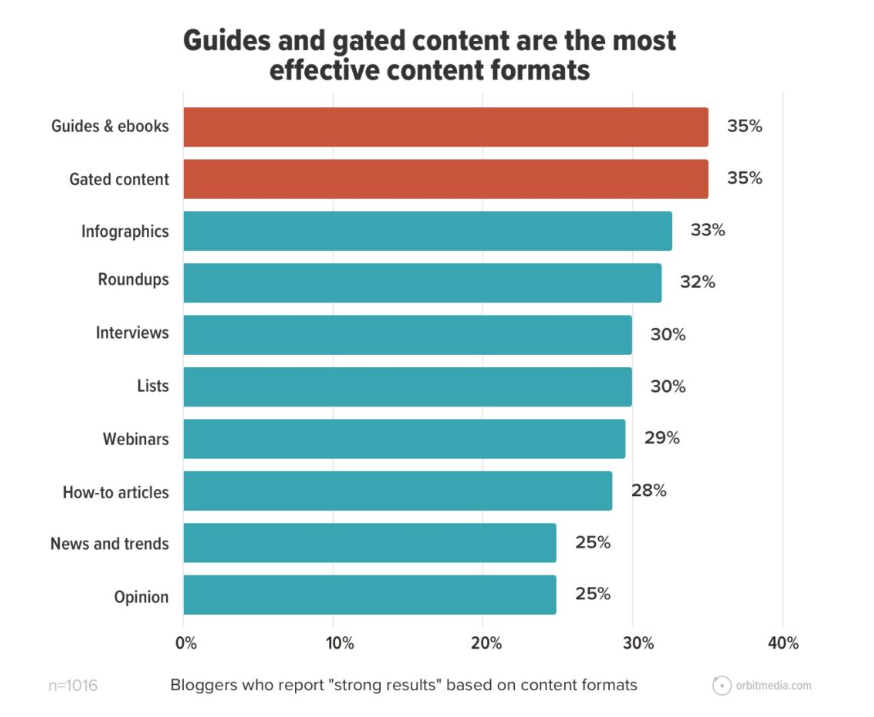
- Bloggers report that their most effective content types are Guides & ebooks (35%) and Gated content (35%) (Orbit Media, 2022)
- In 2022, 29% of bloggers published new posts on a weekly basis. The bloggers who publish 2-6 times per week are 50% more likely to report strong results. (Orbit Media, 2022)

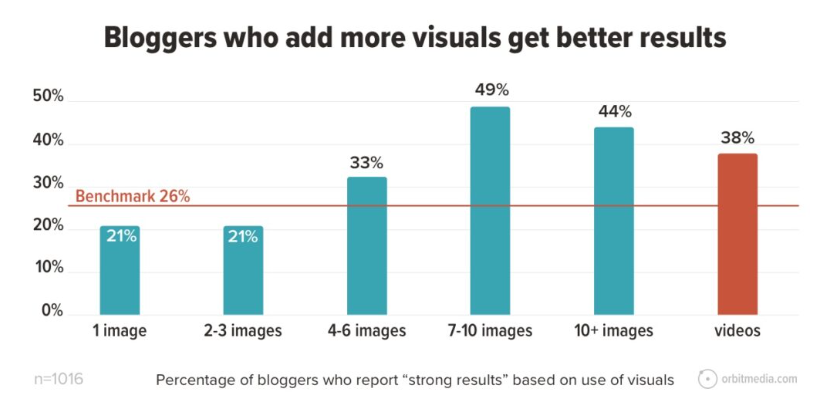
- 47% of bloggers typically include two or three images in their posts. Only 3% report including ten or more. (Orbit Media, 2022)
- 1 in 4 bloggers adds a video to articles (Orbit Media, 2022)
- The more bloggers add images and videos, the more likely they are to report success. Bloggers who use 7+ images per post are 2.3x more likely to report strong results. (Orbit Media, 2022)
- The average blog bounce rate is 82.4%. (Siege Media, 2022)
- 22% of worldwide bloggers post on a weekly basis. (Statista, 2021)
- The ideal blog post length for SEO purposes is 2,100-2,400 words. (HubSpot, 2020)
- Long articles/posts stood out as an area where those who are most successful reported better results than respondents overall (43% vs. 32%). (Content Marketing Institute, 2022)
- On average, content marketers reported that 53% of the content they create is for the middle of the funnel. Only 35% of the content they create is for the top of the funnel, 25% for retention, and 22% for the bottom of the funnel. (Semrush, 2022)
Content Writing Statistics 2024
- The “Everything You Need To Know” titles and Comparison articles generate the most organic traffic on average. (Semrush, 2023)

- Articles with “Mistakes To Avoid” titles and Guides get the most shares (Semrush, 2023)

- How To and Comparison articles attract the most backlinks (Semrush, 2023)

- Headings with “Guide” in the title attract thee times more organic traffic than others, and those containing “How to” outperform by 1.5 times (Semrush, 2022)

- Articles with seven or fewer words in their H1 get 36% more organic traffic on average than those with 14 or more words. (Semrush, 2022)

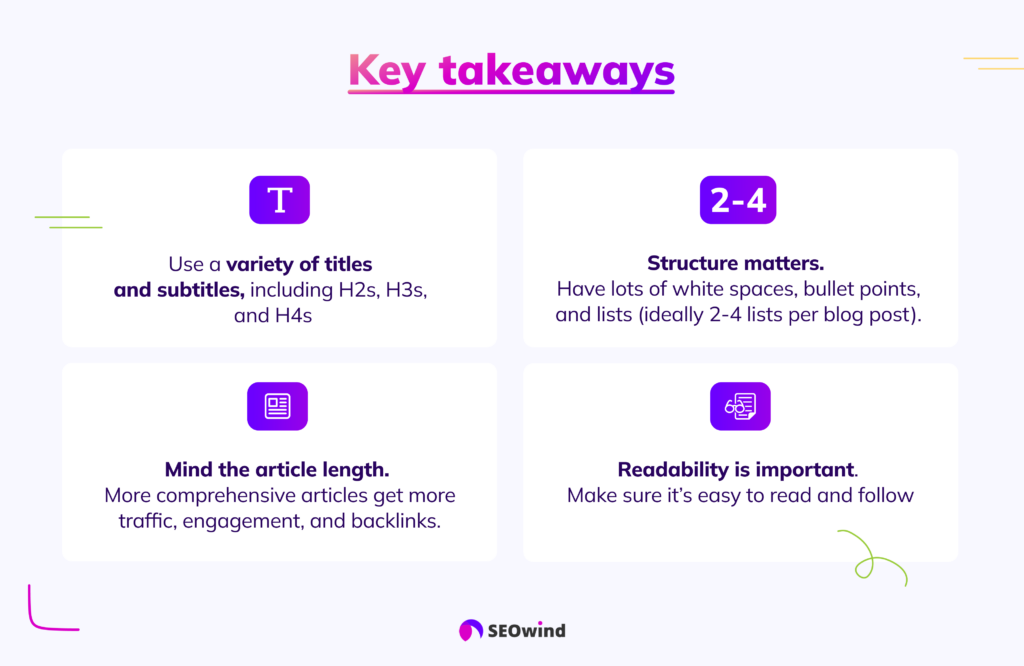
- 47% of articles that have an advanced headings structure (H2 + H3 + H4) belong to the highest-performing organic content group (Semrush, 2022)

- While the most common article type had only H2 tags, 28% of the blog posts in the high-performance group have H2s and H3s. And 29% of them have H2s, H3s, and H4 tags. (Semrush, 2023)

- 35% of articles with no H2 are low-performing (Semrush, 2023)

- Articles with one or two lists per 500 words get 68% more traffic than those with no lists (Semrush, 2022)

- Articles with 3-4 lists do better across all metrics. On the other hand, articles with no lists are the most common (68%)—and these underperform. (Semrush, 2023)

- Articles over 3,000 words get 138% more traffic than those with fewer than 500 words (Semrush, 2022)

- 78% of articles with fewer than 500 words have not been shared (Semrush, 2022)

- Only 16.73% of high-performing blogs were found to be very difficult to read. In contrast, 33.45% of high-performing blogs were fairly easy to read. (Semrush, 2023)

Visual Content Marketing Statistics 2024
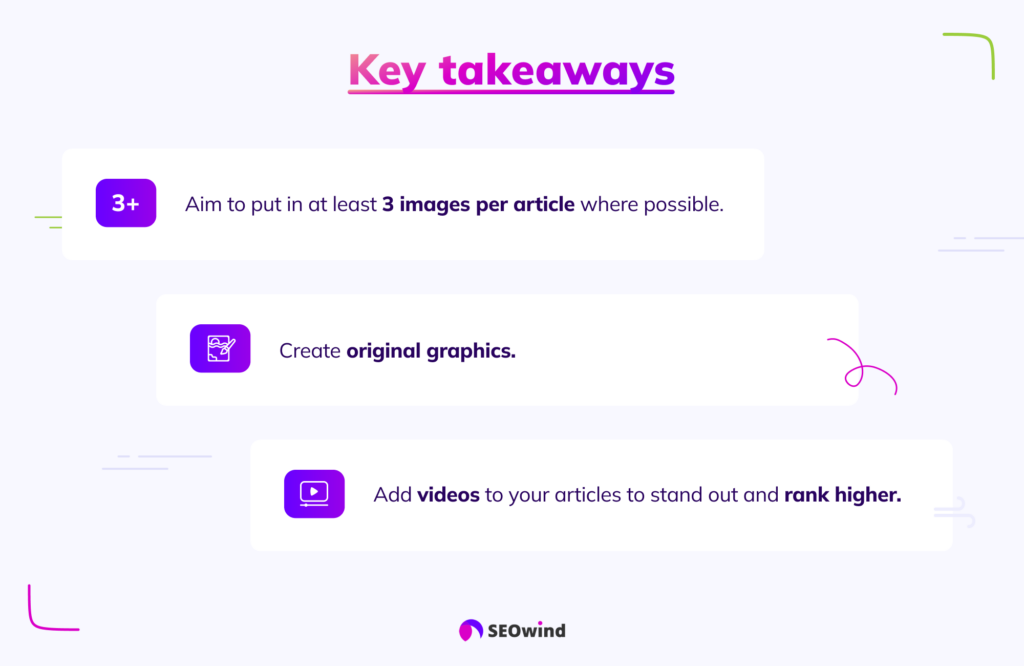
- Adding more visuals (images and videos) to blog posts takes 3rd place among tactics that help blog posts rank higher (reported by 33% of marketers). (Semrush, 2023)

- Articles with more than seven images get 116% more organic traffic than articles containing just text. (Semrush, 2022)

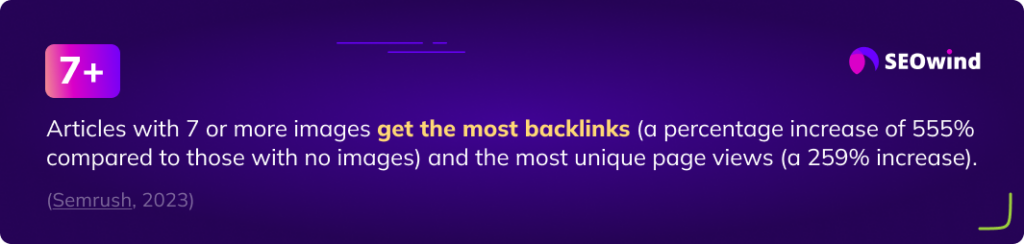
- Articles with 7 or more images get the most backlinks (a percentage increase of 555% compared to those with no images) and the most unique page views (a 259% increase). (Semrush, 2023)
- 31.8% of marketers report that creating engaging visual content consistently is one of their biggest struggles. (Venngage, 2022)
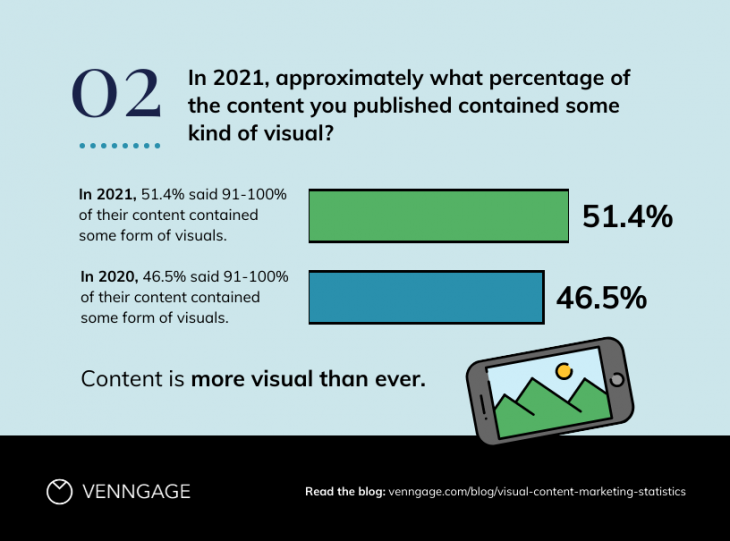
- Every year, the use of visuals in content grows. In 2021, 51.4% said 91%-100% of their content contained some form of visuals (compared to 46.5 in 2020). (Venngage, 2022)
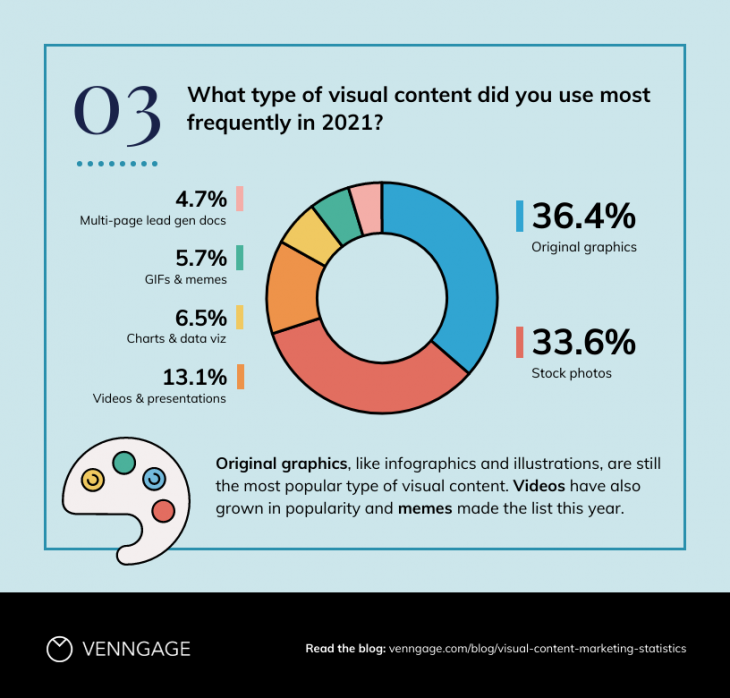
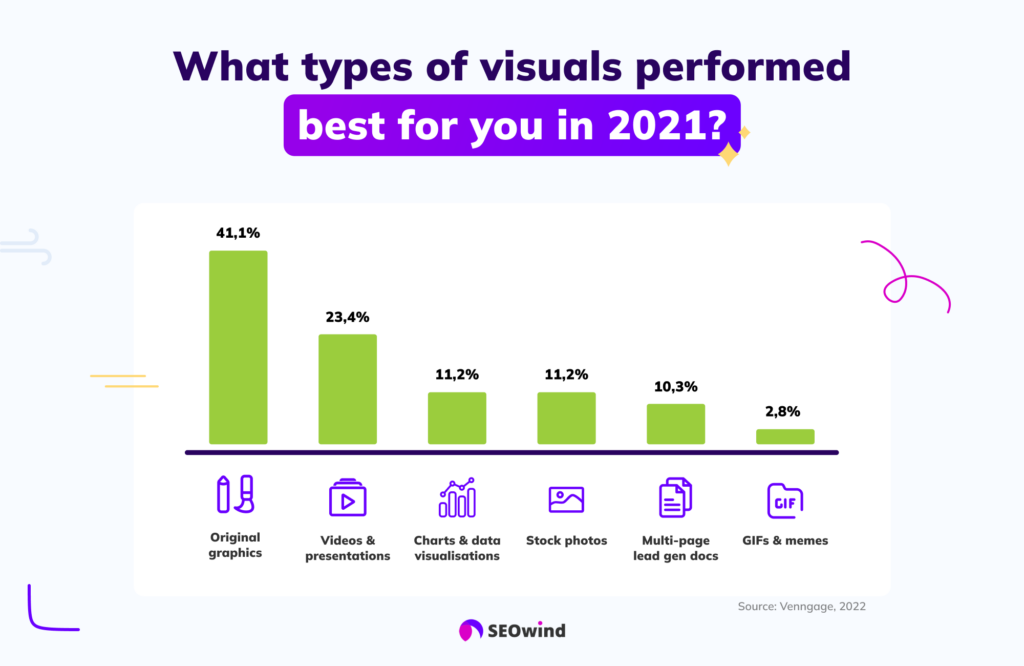
- 36.4% of marketers used original graphics (like infographics and illustrations) for their visual content, while 33.6% used a majority of stock photos in 2021. Videos and presentations grew in popularity: 13.1% of marketers reported using this medium the most. (Venngage, 2022)
- 41% said original graphics worked best for them, while only 11.2% said stock photos worked best. Videos and presentations were the second most helpful type of visual content: 23.4% of marketers voted for these mediums. Charts and data visualizations and stock photos tied for third in terms of best-performing visual content. (Venngage, 2022)
Video Content Marketing Statistics 2024
- Articles with videos get 8.3% more traffic than those without, whereas articles with more than three videos generated 55% more backlinks than those with none. (Semrush, 2022)

- 87% of marketers stated that creating video content increases their website traffic (Wyzowl, 2022)
- Articles with at least one video also generate 70% more organic traffic than those without. (Semrush, 2023)

- Only 8% of all blog posts we analyzed had a video. (Semrush, 2023)

- 43% of respondents pointed to Short-form video formats performing best. (Semrush, 2023)

- 91% of businesses use video as a marketing tool in 2023. This is an all-time high since 2016. (Wyzowyl, 2023)
- 70% of ‘non-video-marketers’ plan to start online video marketing in 2023. (Wyzowyl, 2023)
- 95% of video marketers say that video marketing has helped them increase brand awareness, while 91% say that it has helped increase traffic. (Wyzowyl, 2023)
- 96% of people have watched an explainer video to learn more about a product or service. (Wyzowyl, 2023)
- 89% of people say watching a video has convinced them to buy a product or service. (Wyzowyl, 2023)
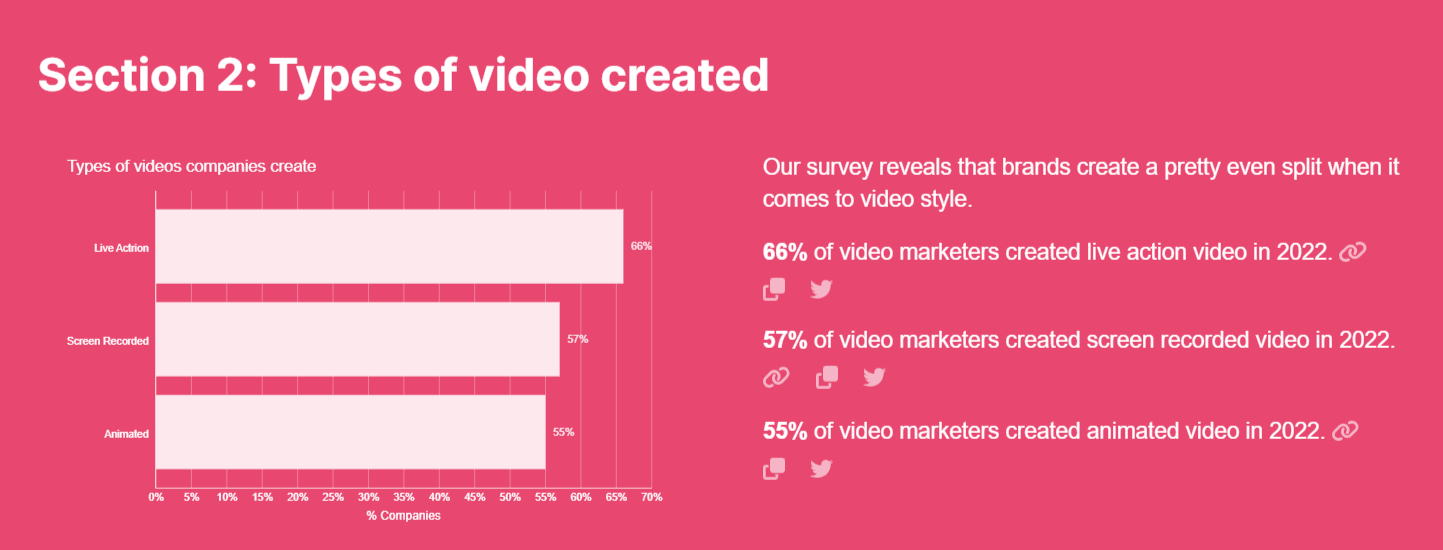
- According to a report by Wyzowl in 2023, 66% of marketers created live-action videos, while 57% created screen-recorded videos. Additionally, 55% of marketers used animated videos. (Wyzowyl, 2023)
- YouTube is the most widely used video marketing platform with 90% of video marketers trusting the world’s #1 video site. Next up is Facebook (86%), followed by Instagram (79%) and LinkedIn (also 79%) as a string to their video marketing bow. (Wyzowyl, 2023)
- 90% of marketers using short-form video will increase or maintain their investment next year, and 1 in 5 marketers plan to leverage short-form video for the first time in 2023. (Hubspot, 2022)
Content Marketing Market Size Statistics
- The content marketing industry is expected to be worth $412.88 billion by 2023 The global content marketing market size is estimated to increase by USD 584.02 billion between 2022 and 2027. (Technavio, 2022)
- The market’s growth momentum will progress at a CAGR of 16.37%. (Technavio, 2022)
AI Content Marketing Statistics
- 3 out of 4 B2B marketers use generative AI tools in content and marketing. 72% of respondents say they use generative AI tools. (Content Marketing Institute, 2023)
- Among those who use generative AI tools, 91% use free tools (e.g., ChatGPT). 38% use tools embedded in their content creation/management systems, and 27% pay for AI tools. (Content Marketing Institute, 2023)
- About half (51%) use generative AI to brainstorm new topics. Many use the tools to research headlines and keywords (45%) and write drafts (45%). Fewer say they use AI to outline content (23%), proofread (20%), generate graphics (11%), and create audio (5%) and video (5%). (Content Marketing Institute, 2023)
- Asked if their organizations have guidelines for using generative AI tools, 31% say yes, 61% say no, and 8% are unsure. (Content Marketing Institute, 2023)
- The top 3 main reasons why B2B marketers don’t use generative AI tools include accuracy concerns (36%), lack of training (27%), and lack of understanding (27%). 22% percent cite copyright concerns, and 19% have corporate mandates not to use them. (Content Marketing Institute, 2023)
Most Important Content Marketing Statistics according to marketing experts
- 28% of Marketers Use PR and Media Outreach (Semrush, 2023)
Public relations is an integral part of content marketing, as it amplifies the content’s reach and impact. It serves to build relationships with influencers, journalists, and other stakeholders to promote content across multiple channels. Ultimately, 28% of marketers using PR and media outreach to promote their content is a crucial statistic that marketers should know as they plan and develop their 2023 content marketing strategy, claims Gosia Hytry, Head of Content, Spacelift.
- By 2024, it’s projected that there will be 8 billion digital voice assistants in use worldwide. (Statista, 2022)
Nick Cotter, Founder, newfound makes the point: This shows the growing importance of optimizing content for voice search and using this technology in content marketing strategies. Voice search is becoming increasingly popular because of the convenience and ease of use it provides, especially for mobile users. Marketers who optimize their content for voice search can improve their visibility and reach a wider audience, as well as enhance the user experience.