With the competition for clicks on search engines growing fiercer, effective search engine optimization (SEO) has become more critical than ever before. So, if you’re going to develop an SEO strategy that can compete against a larger number of other businesses, you’ll need to know the latest trends and developments. With that in mind, we’ve collected an extensive number of recent SEO statistics and analytic data. These will lay out how marketers view optimization strategies as well as what consumers want from businesses.
As the adage goes, knowledge is power. As you prepare to wade into an increasingly challenging arena, make sure to arm yourself in advance with the most up-to-date information from 2020 and later. After reading through these statistics, you’ll have a better understanding of modern SEO tactics. Then, you’ll be properly equipped to develop a strategy that fits your particular business needs.
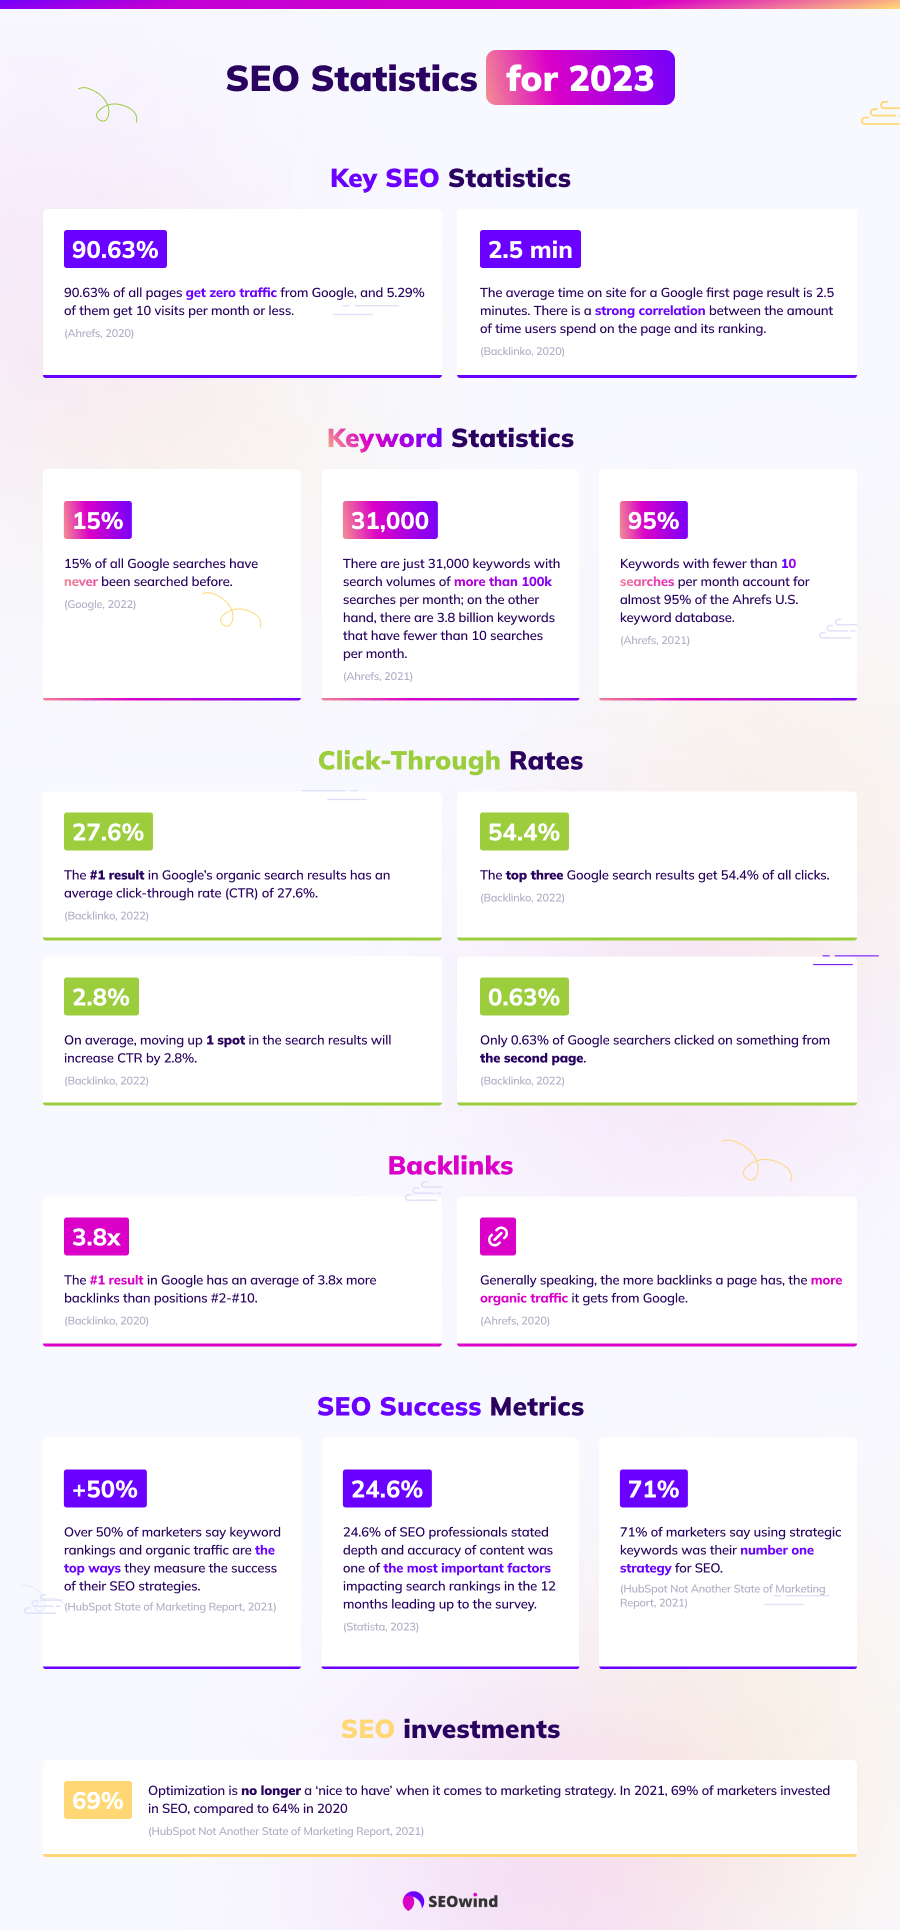
Infographic – Key SEO Statistics for 2024
In this infographic, we’ll take a look at the key SEO statistics for 2024 that you should be aware of.
Key SEO Statistics for 2024
- The #1 result in Google’s organic search results has an average click-through rate (CTR) of 27.6%. (Backlinko, 2022)
- On average, moving up 1 spot in the search results will increase CTR by 2.8%. However, this depends on where you’re moving from and to. Moving from position #3 to position #2 will usually result in a significant CTR boost. However, moving from #10 to #9 doesn’t make a statistically significant difference. (Backlinko, 2022)
- During a 2021 survey carried out among search engine optimization (SEO) professionals worldwide, 24.6 percent stated depth and accuracy of content was one of the most important factors impacting search rankings in the 12 months leading up to the survey. On-page elements, such as meta titles or descriptions, ranked first, mentioned by 32.8 percent of respondents. (Statista, 2023)
- 75% of marketers feel their SEO tactics are ‘extremely effective’ or ‘very effective’ at helping them achieve their marketing goals. (HubSpot Not Another State of Marketing Report, 2021)
- 83% of respondents are either ‘very confident’ or ‘somewhat confident’ that their website is helping them reach their marketing goals (HubSpot Not Another State of Marketing Report, 2021)
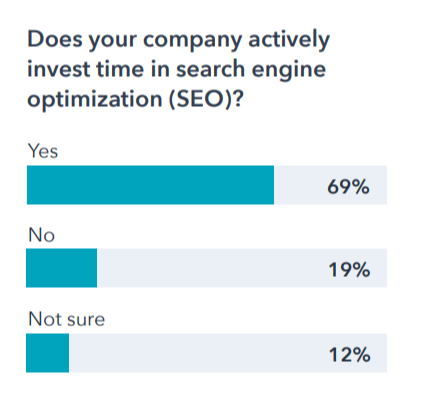
- Optimization is no longer a ‘nice to have’ when it comes to marketing strategy. In 2021 69% of marketers invested in SEO, compared to 64% in 2020 (HubSpot Not Another State of Marketing Report, 2021)
- Brand awareness matters, but it’s not a deal-breaker. The slight majority, 55%, said that they would only click on a brand they knew in the search results, while 44.9% would still click regardless of if they knew the brand. (Ignite Visibility, 2020)
- 90.63% of all pages get zero traffic from Google, and 5.29% of them get ten visits per month or less. (Ahrefs, 2020)
Organic Traffic Statistics for 2024
- Generally speaking, the more backlinks a page has, the more organic traffic it gets from Google. (Ahrefs, 2020)
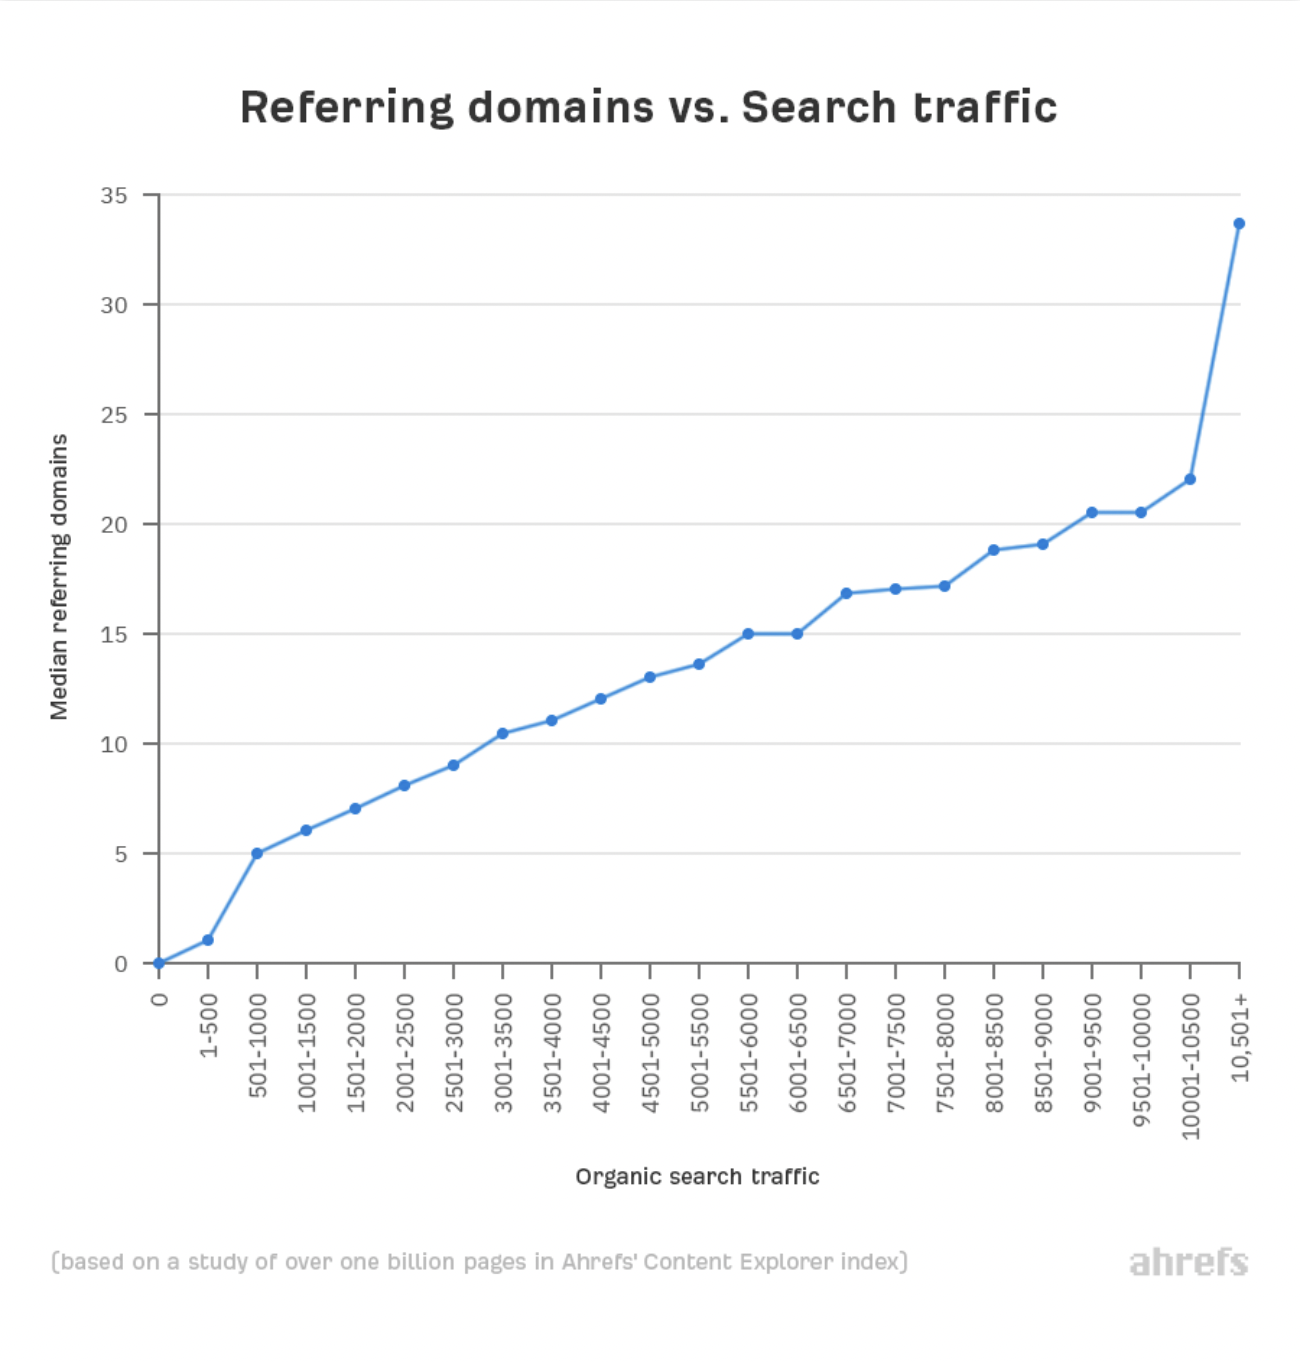
According to Ahrefs, there is a positive correlation between the number of referring domains and a page’s organic search traffic.
- There is a similar correlation between referral domains and keyword ranking. (Ahrefs, 2020)
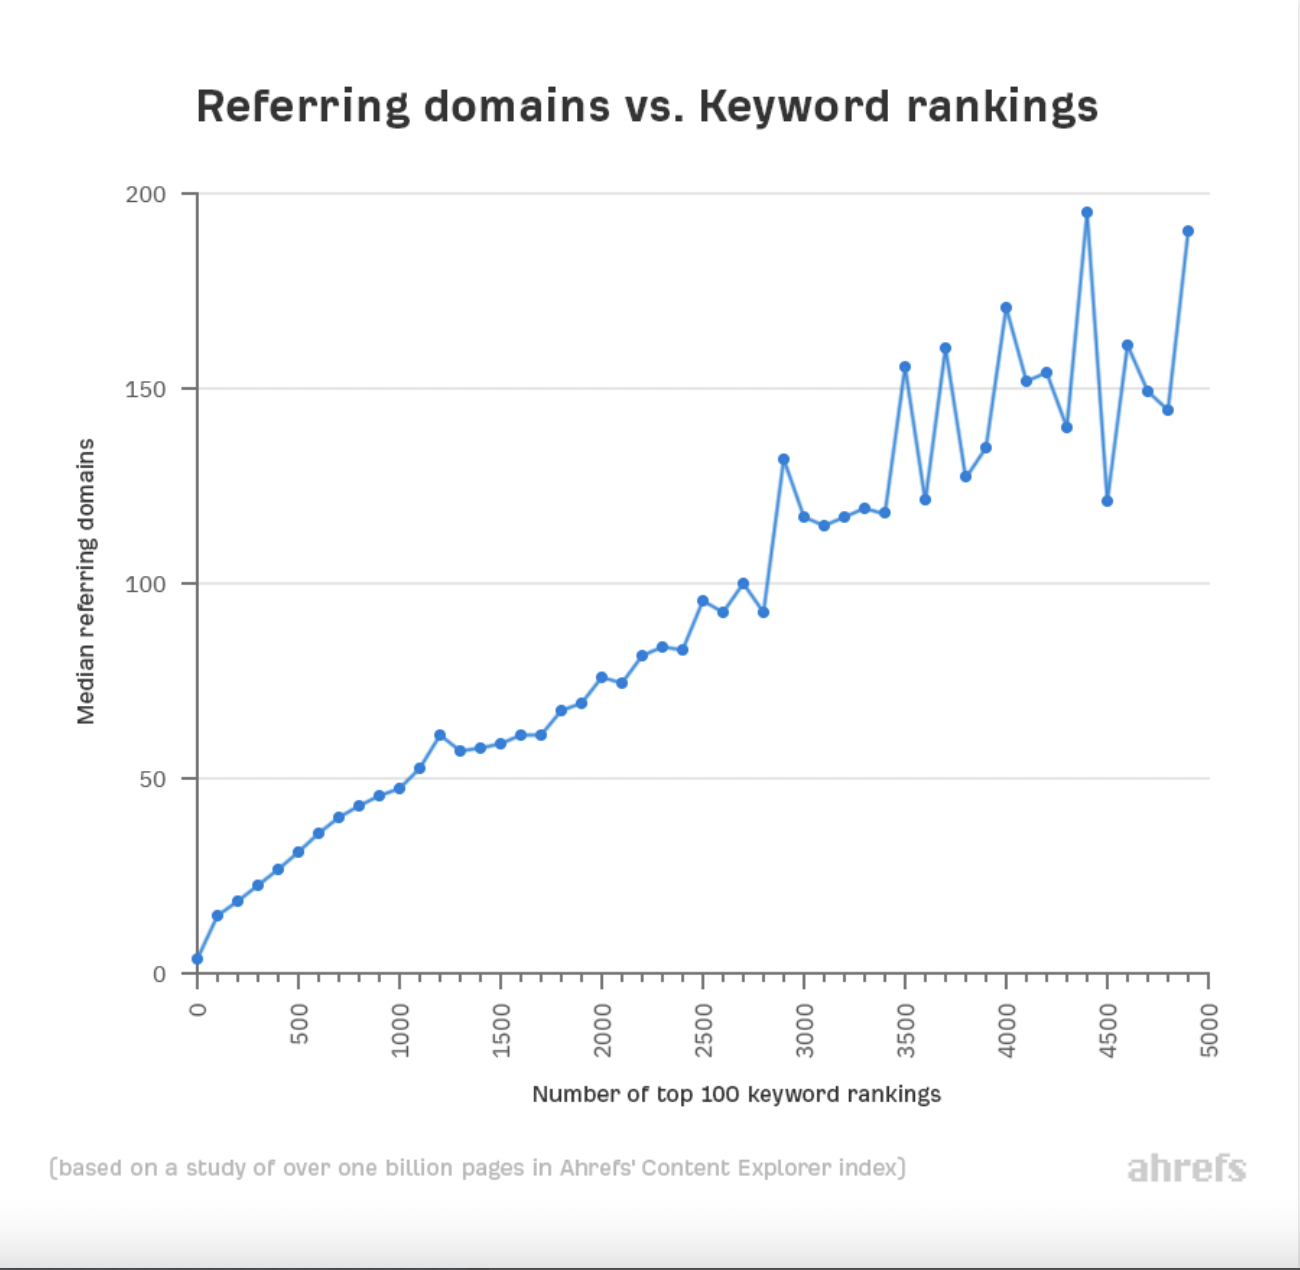
Just like with organic traffic, Ahrefs identifies a relationship between the number of referring domains and keyword rankings.
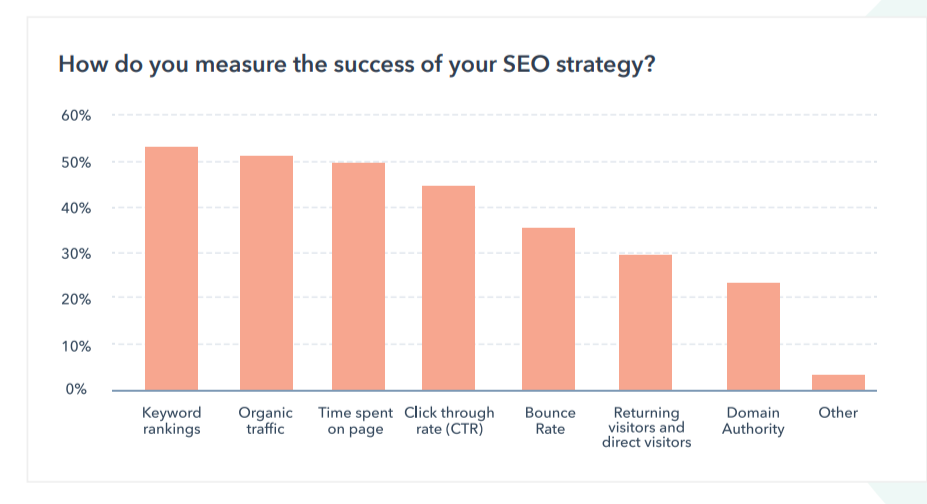
- Over 50% of marketers say keyword rankings and organic traffic are the top ways they measure the success of their SEO strategies. (HubSpot State of Marketing Report, 2021)
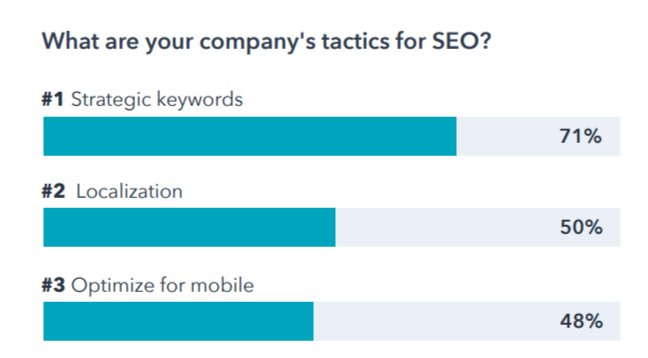
- 71% of marketers say using strategic keywords was their number one strategy for SEO. (HubSpot Not Another State of Marketing Report, 2021)
- While direct traffic represents the largest portion of web traffic through search engines at 22%, organic traffic represents the second highest portion of visitors at 17%. In addition, social media, email marketing, and display ads each command over 10% of traffic (16%, 14%, and 12% respectively). (HubSpot, 2022)
Ranking Statistics for 2024
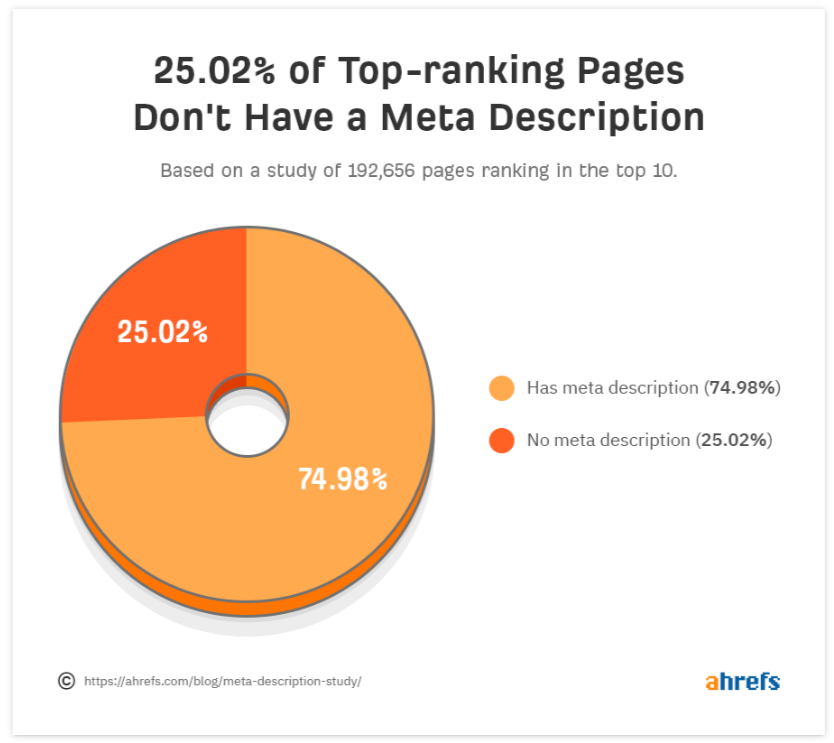
- 25.02% of top-ranking pages don’t have meta descriptions. (Ahrefs, 2020)
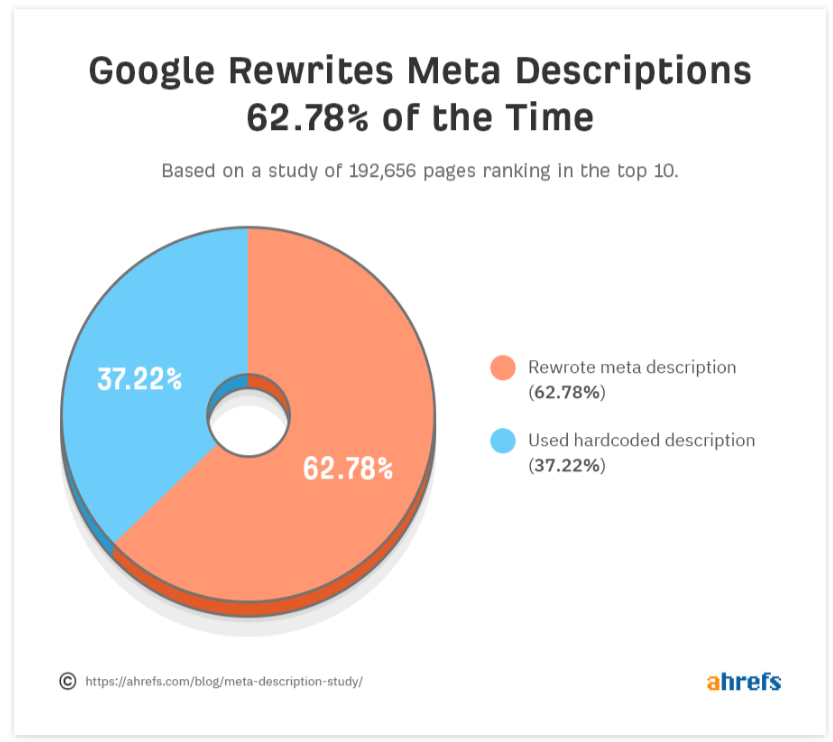
- Google rewrites meta descriptions 62.78% of the time. That number drops to 59.65% for fat-head and rises to 65.62% for long-tails. (Ahrefs, 2020)
- Based on a study of 953,276 pages ranking in the top 10 in 2021, 7.4% of top-ranking pages don’t have a title tag. (Ahrefs, 2021)
- For those pages that do have a title tag, Google rewrites their title tag 33.4% of the time. (Ahrefs, 2021)
- For B2B websites, a site that loads in 1 second has a conversion rate 3x higher than a site that loads in 5 seconds. Meanwhile, the difference in conversion rate between blazing fast sites and slow sites is even more pronounced. A site that loads in 1 second has a conversion rate 5x higher than a site that loads in 10 seconds. (Portent, 2022)
- In general, the average time on site for a Google first page result is 2.5 minutes. There is a strong correlation between the amount of time users spend on the page and its ranking. This could be indicative of Google using time on page as a ranking factor, or it could simply mean that higher-quality content naturally captures users attention for a longer period of time. (Backlinko, 2020)
Backlink Statistics for 2024
- 66.31% of pages have no backlinks. (Ahrefs, 2020)
- 43.7% of the top-ranking pages have some reciprocal links. (Ahrefs, 2020)
- The #1 result in Google has an average of 3.8x more backlinks than positions #2-#10. (Backlinko, 2020)
- 67% of marketers use Domain Rating (Ahrefs) as the primary metric by which they measure authority and link quality. (Aira, 2022)
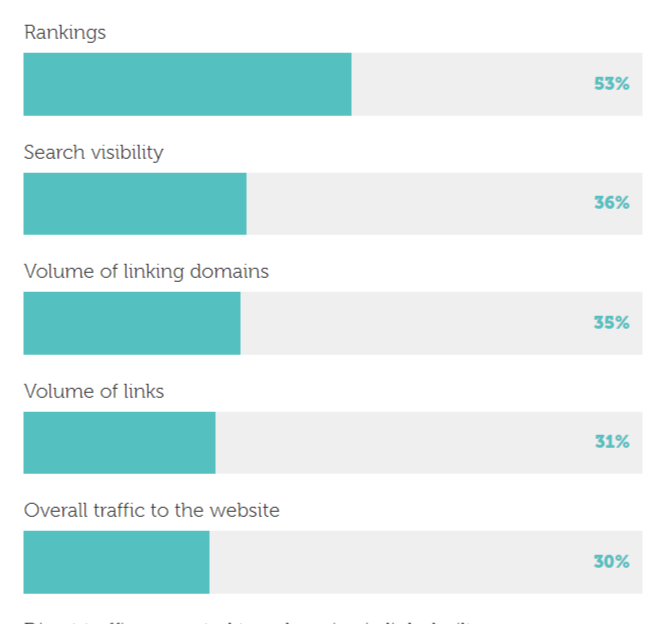
- 53% of marketers believe that ranking is the primary KPI that measures the effectiveness of their link-building strategy. (Aira, 2022)
- 89% of marketers produce content with the goal of building links. (Aira, 2022)
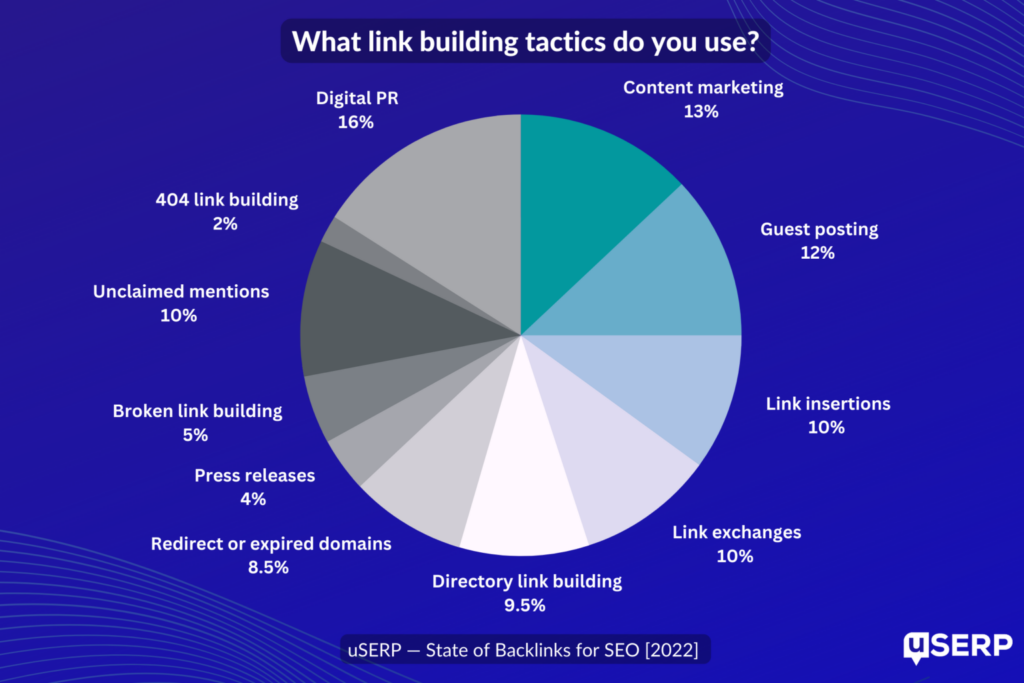
- There is no universally agreed upon best strategy for link building. 16% of respondents in the uSERP report believe that Digital PR is the most effective tactic, while 13% selected content marketing, 12% indicated guest posting, and 10% selected either link insertions or link exchanges as their preferred strategy. (uSERP, 2023)
Keyword Statistics for 2024
- 15% of all Google searches have never been searched before. (Google, 2022)
- While Google Search Console (GSC) is widely considered a comprehensive and accurate source of data, 46.08% of the clicks it tracks go to hidden terms. (Ahrefs, 2022)
- There are just 31,000 keywords with search volumes of more than 100k searches per month; on the other hand, there are 3.8 billion keywords that have fewer than 10 searches per month. (Ahrefs, 2021)
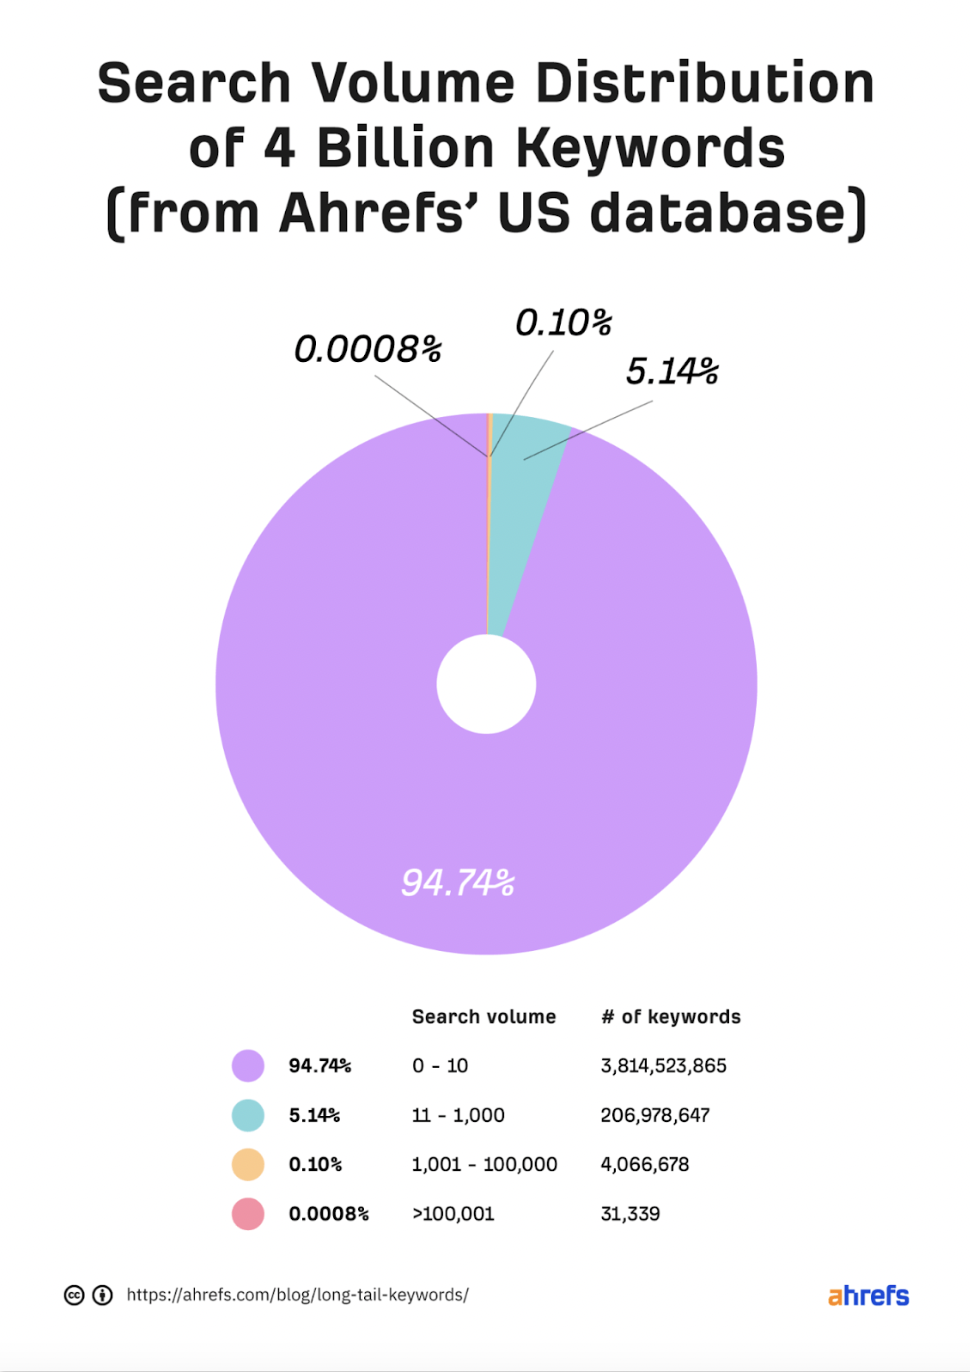
An Ahrefs review of keywords and search volume.
- Long-tail keywords outrank generic one-word keywords by 3-6% at the 2-5 position of SERPs in terms of CTR. Typically this will be because long-tail searches occur further down the sales funnel so users are more discerning at this stage. (Smart Insights, 2023)
- Keywords with fewer than 10 searches per month account for almost 95% of the Ahrefs U.S. keyword database. (Ahrefs, 2021)
SEO Industry Statistics for 2024
- For monthly retainers, $501–$1,000 per month is the most popular pricing tier. (Ahrefs, 2023)
- For hourly pricing, $100–$150 per hour is the most popular pricing tier. (Ahrefs, 2023)
- For per-project pricing, $501–$1,000 is the most popular pricing tier. (Ahrefs, 20232)
- On average, the cost for hourly SEO work is $100 to $250 per hour. This is most common with freelancers or independent contractors offering services to smaller companies. (Accelerate Agency, 2022)
- The average cost for project-based SEO services ranges from $1,000 to $1 million and up. Smaller companies using local SEO could spend roughly $1,000 a month per project. Larger, enterprise-level companies can expect to pay millions of dollars a month. (Accelerate Agency, 2022)
- Costs for a monthly retainer are on average more than $10,000 per month. This most often applies to larger SEO and marketing agencies. Monthly SEO packages often include a specific set of services, such as Keyword research, competitor research, SEO content writing, technical audits, content marketing audits, link building, digital PR, ongoing SEO, and technical consultation as well reporting and insights. However, some agencies allow you to build a custom plan with an agreed monthly price. (Accelerate Agency, 2022)
Search Engine Statistics 2024
- As of January 2023, the online search engine Bing accounted for 8.85 percent of the global search market, while market leader Google had a share of around 84.69 percent. Meanwhile, Yahoo’s market share was 2.59 percent. (Statistica, 2023)
- In 2022, 21 of 23 industries saw an increase in cost per lead (CPL) year over year, with an average overall increase of 19%. This is significantly higher than 2021’s increase of 5%, in contrast to 2020’s decrease of 4%, but actually similar to 2019’s increase of 21%. (WordStream, 2022)
- In 2022, 91% of industries saw a decrease in conversion rate, with an average overall decrease of 14%. While this is a stronger decrease than in 2021, it is not far off from 2019’s 12% decrease. (WordStream, 2022)
- Amazon now leads in product searches with over 54% of all product searches now happening on Amazon instead of Google. What this means is that brands must make Amazon SEO their priority in order to show up near the top of product searches for their related keywords. (WebProNews, 2022)
Google Search Statistics for 2024
- The top three Google search results get 54.4% of all clicks. (Backlinko, 2022)
- Only 0.63% of Google searchers clicked on something from the second page. (Backlinko, 2022)
- The average Google first page result contains 1,447 words. (Backlinko, 2020)
- In January 2023, Google saw 88.3 billion visits that lasted an average of 10 minutes and 53 seconds. Those searches experienced a bounce rate of 28.51%. Users visited an average of 8.49 pages per search. (Similarweb, 2023)
Local SEO statistics for 2024
- Nearly 70% said that more than half of their search activity has a local intent, meaning it’s focused on businesses, services, and activities in their area. Local intent as a percentage of overall search volume was even more pronounced among Millennials and Gen Z. (Uberall, 2021)
- When asked to list their five most valuable channels for attracting new clients, 46% of local marketers included SEO, while 57% included word of mouth. Both of these numbers represent an increase from the previous year and indicate the importance of a multi-pronged local SEO strategy. (Bright Local, 2022)
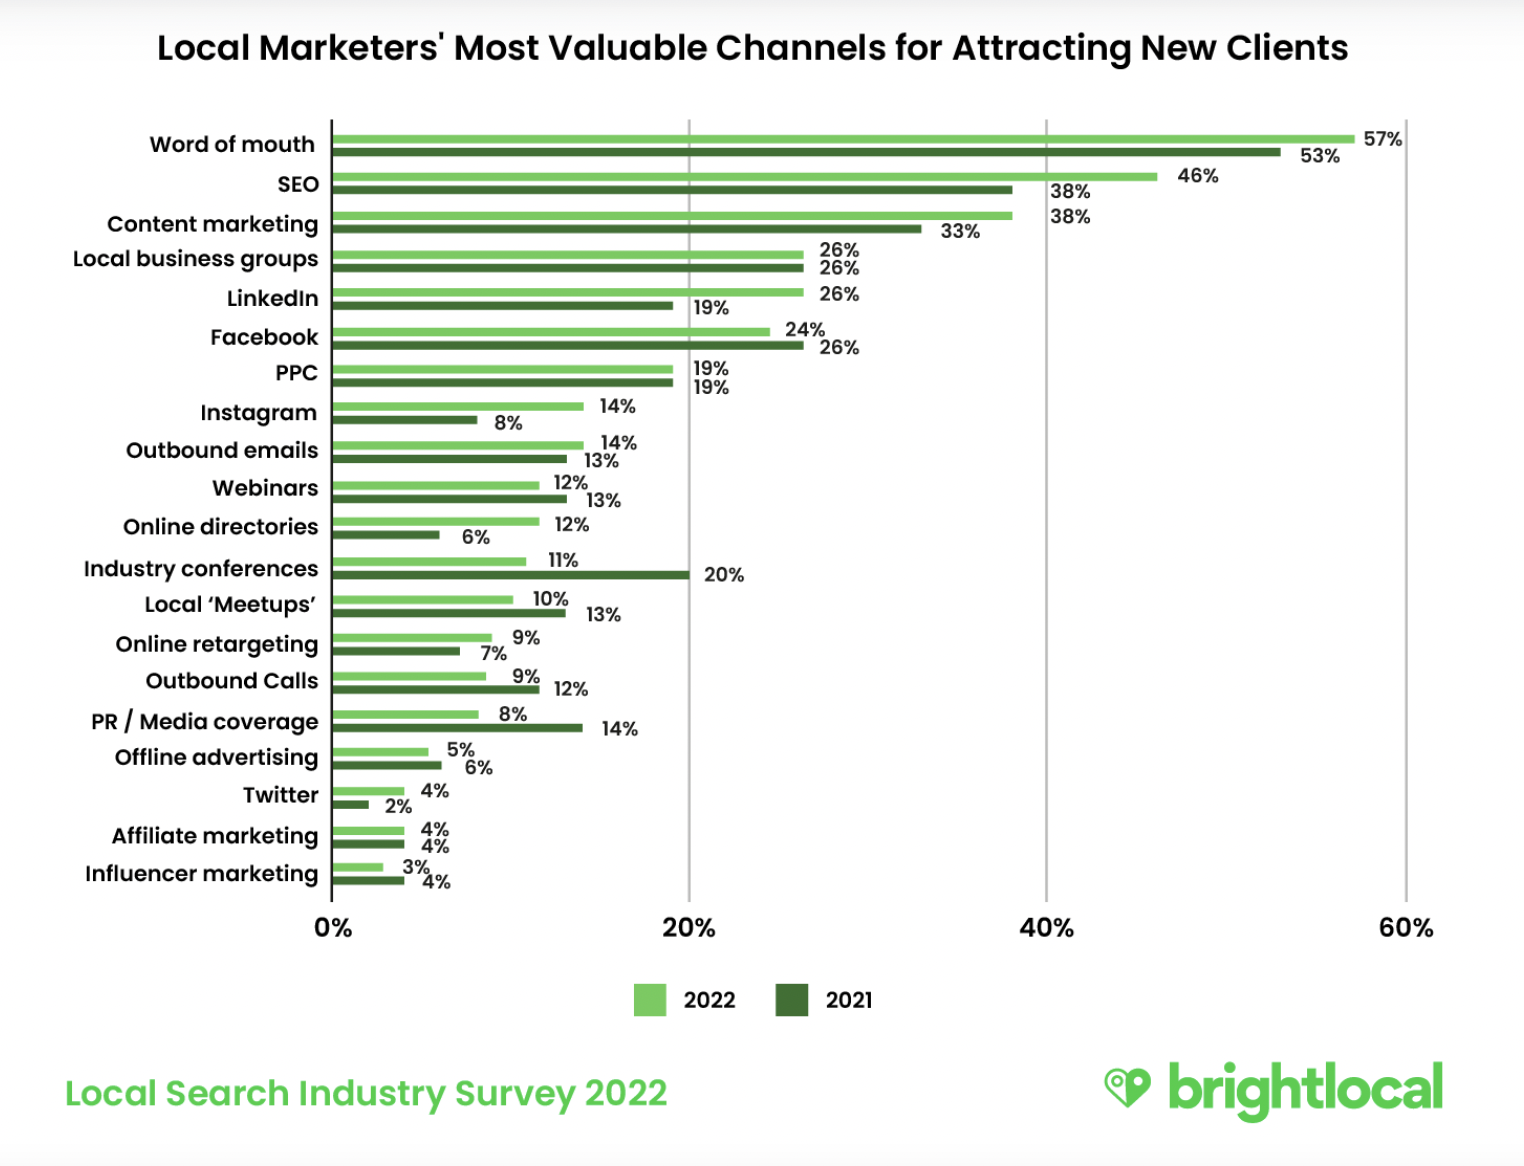
A Bright Local survey looks into the most valuable local SEO channels for attracting new clients.
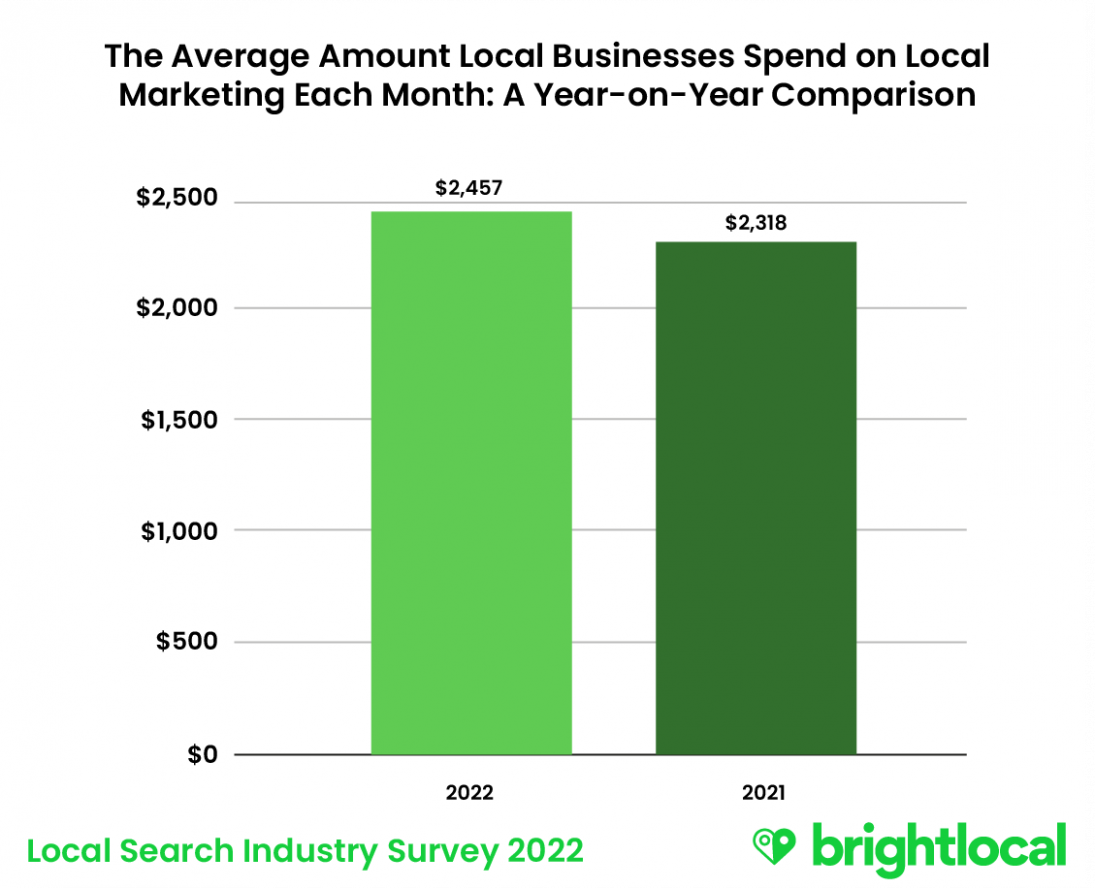
- When looking at trends in local SEO spending, local businesses were found to spend approximately $139 more each month in 2022 than last year. (Bright Local, 2022)
- The US has the lowest click-through rates both for the Top 10 search results and the Top 20. (seoClarity, 2021)
Video SEO Statistics for 2024
- 91% of businesses use video as a marketing tool in 2023. This is an all-time high since 2016. (Wyzowyl, 2023)
- 70% of ‘non-video-marketers’ plan to start online video marketing in 2023. (Wyzowyl, 2023)
- 95% of video marketers say that video marketing has helped them increase brand awareness while 91% say that it has helped increase traffic. (Wyzowyl, 2023)
- 96% of people have watched an explainer video to learn more about a product or service. (Wyzowyl, 2023)
- 89% of people say watching a video has convinced them to buy a product or service. (Wyzowyl, 2023)
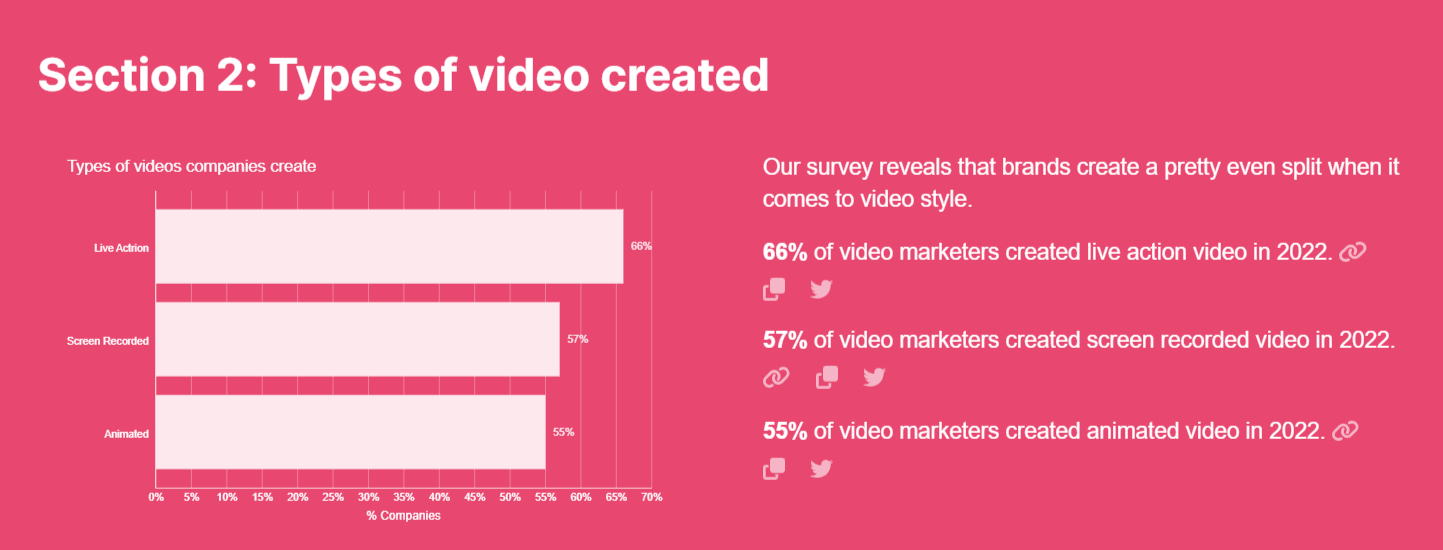
- According to a report by Wyzowl in 2023, 66% of marketers created live-action videos, while 57% created screen-recorded videos. Additionally, 55% of marketers used animated videos. (Wyzowal, 2023)
- YouTube is the most widely used video marketing platform with 90% of video marketers trusting the world’s #1 video site. Next up is Facebook (86%), followed by Instagram (79%) and LinkedIn (also 79%) as a string to their video marketing bow. (Wyzowyl, 2023)
- 90% of marketers using short-form video will increase or maintain their investment next year, and 1 in 5 marketers plan to leverage short-form video for the first time in 2023. (Hubspot, 2022)
Mobile SEO Statistics for 2024
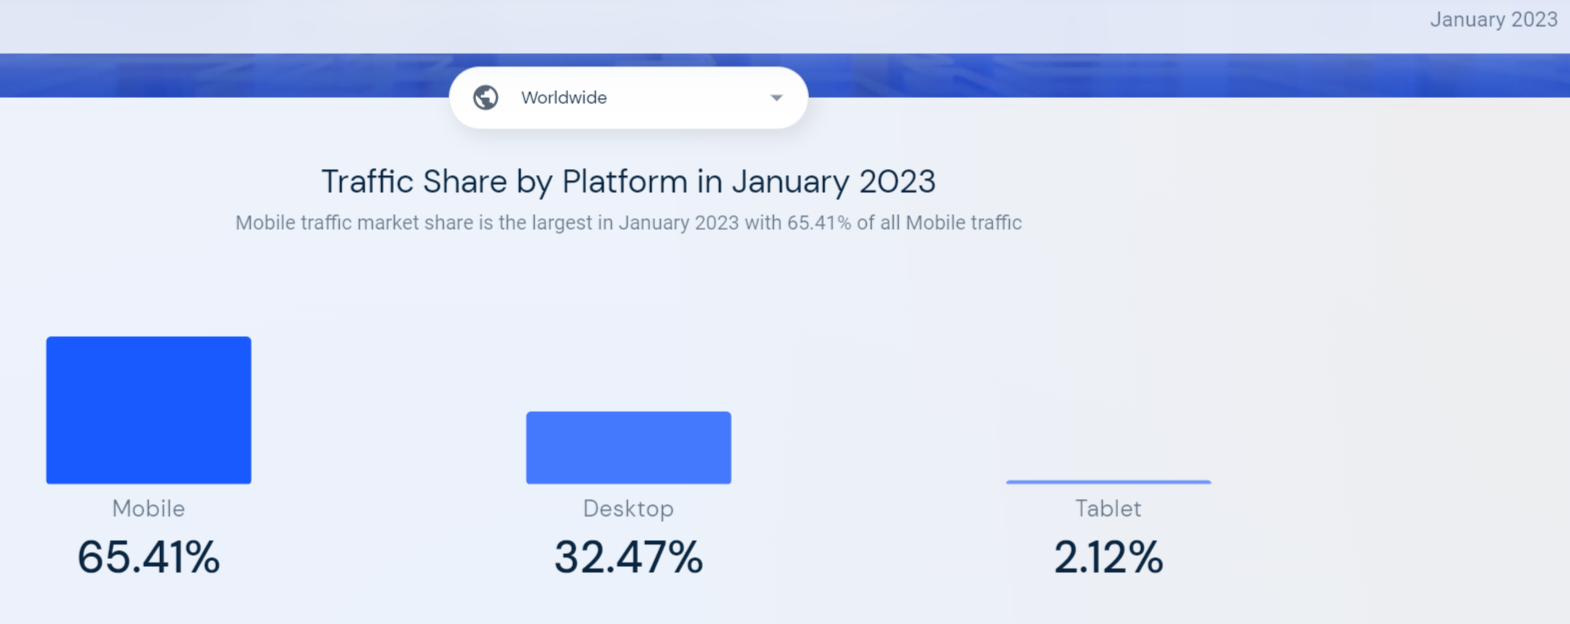
- Over the last year, mobile users have made up more than 60% of the total online traffic share. In January 2023, mobile users represented 65.41% of this traffic compared to 35.47% for desktop users and 2.12% for tablet users. (Similarweb, 2023)
- Mobile accounts for approximately half of the web traffic worldwide. In the fourth quarter of 2022, mobile devices (excluding tablets) generated 59.16 percent of global website traffic after consistently hovering around the 50 percent mark since the beginning of 2017 before permanently surpassing it in 2020. (Statista, 2023)
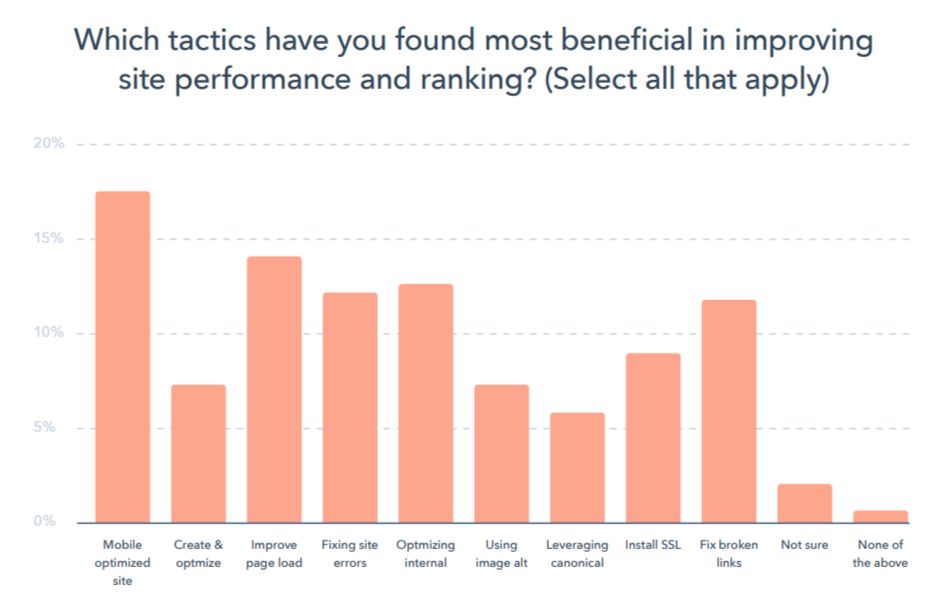
- Almost 25% of companies invest in mobile optimization as a top SEO tactic. (HubSpot, Not Another State of Marketing Report, 2020)
- Mobile users are less likely to click top-ranked listings than desktop users. (seoClarity, 2021)
- 96% of all mobile searches that took place in the first quarter of 2020 went through Google. (Statista, 2022)
- Mobile accounts for approximately half of the web traffic worldwide. In the fourth quarter of 2022, mobile devices (excluding tablets) generated 59.16 percent of global website traffic. These numbers have consistently hovered around the 50 percent mark since the beginning of 2017 before permanently surpassing that mark in 2020. (Statista, 2022)
Voice search SEO Statistics for 2024
- As of Spring 2020, 63% of U.S. online users 18 or older reported using a voice-operated personal assistant on at least one device. 51% reported that they did so on their phone, while no other device achieved more than 24% usage of this kind. (National Public Media, 2020)
- The widespread lockdowns resulting from the COVID-19 pandemic resulted in a sudden 70% proliferation in the use of laptops and smartphones as of March 2020. For the same period, a 7% increase in the use of voice assistants worldwide was reported. (GlobalWebIndex, 2020)
- As of 2022, 35% of US consumers possess smart speakers. Smart speaker ownership in Canada follows closely at 30 percent in that same year, followed by Australia at 28 percent. (Statista, 2021)
- 58% of consumers ages 25-34 use voice search daily. Meanwhile, 43% of consumers 55 years and older leverage voice search weekly. (UpCity, 2022)
- As of 2020, virtual assistants represent 82% of the global smart speaker market share. The increasing demand for virtual assistants across industries, including residential and commercial, is expanding the market size. Meanwhile, wireless speakers are expected to experience fast growth due to rising demands. (Fortune Business Insights, 2022)
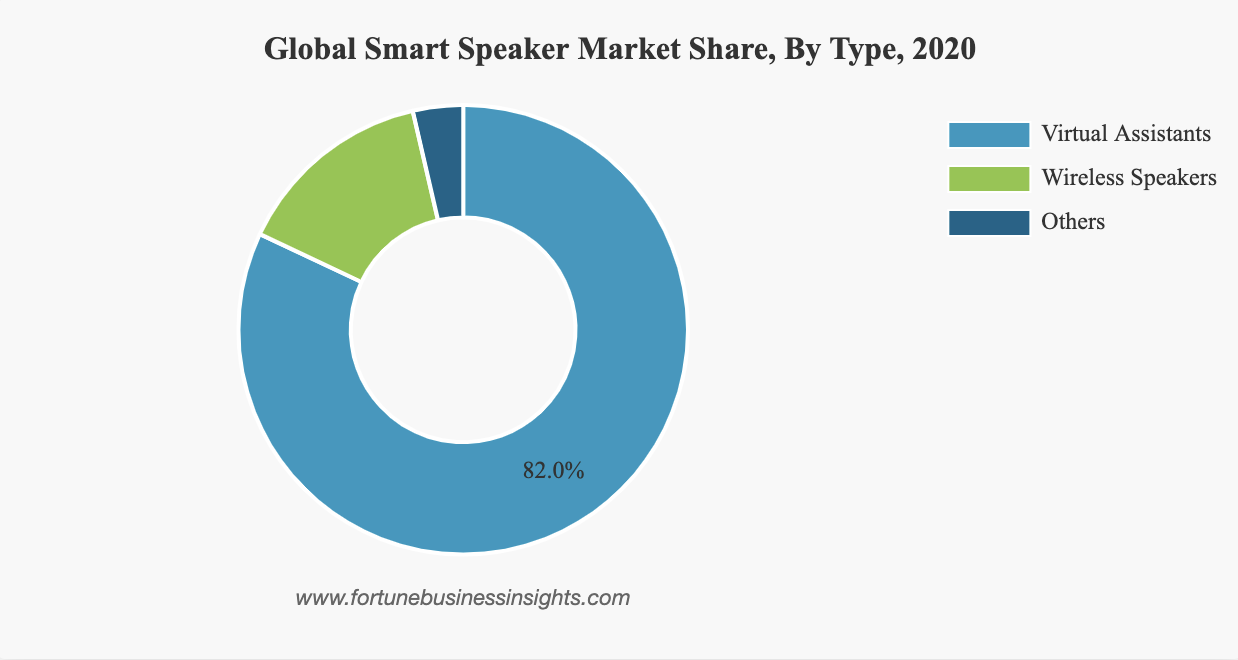
Fortune Business Insights review of global smart speaker market size and the effect of COVID
SEO Statistics Related to Search Generative Experience (SGE) for 2024
- Marketers are getting ready for the SGE launch, with 31% sharpening their focus on user intent/answering questions, 27% creating more thought leadership content, and 22% creating more conversational content.
- The top 3 main reasons why B2B marketers don’t use generative AI tools include accuracy concerns (36%), lack of training (27%), and lack of understanding (27%). 22% percent cite copyright concerns, and 19% have corporate mandates not to use them. Over one-fourth (28%) say they’re not doing any of those things, while 26% say they’re unsure. (Content Marketing Institute, 2023)
References
- Aira (2022). The State of Link Building Report 2022. Retrieved from Aira
- Bawn, P. (2022). Local Search Industry Survey 2022. Retrieved from BrightLocal
- Bianchi, T. (2023). Global desktop market share of search engines 2015-2023. Retrieved from Statista
- Bianchi, T. (2023). Share of global mobile website traffic 2015-2022. Retrieved from Statista
- Bianchi, T. (2022). U.S. total & mobile organic search visits 2020, by engine. Retrieved from Statista
- Brin, D.J. (2022). 50% Of U.S. Consumers Use Voice Search Daily: 2022 Survey. Retrieved from UpCity
- Brown, N. (2022). How much does SEO cost? The true price of SEO services in 2023. Retrieved from AccelerateAgency
- Chaffey, D. (2023). 2023 comparison of Google organic clickthrough rates (SEO CTR) by ranking position. Retrieved from SmartInsights
- Content Marketing Institute (2023). B2B Content Marketing Benchmarks, Budgets, and Trends: Outlook for 2024 [Research]. Retrieved from Content Marketing Institute.
- Dean, B. (2022). We analyzed 4 million google search results. Here’s what we learned about organic click through rate. Retrieved from Backlinko
- Dean, B. (2020). We analyzed 11.8 million google search results. Here’s what we learned about SEO. Retrieved from Backlinko
- Dencheva, V. (2023). Leading SEO factors for search rankings worldwide 2021. Retrieved from Statista
- Fitzgerald, A. (2022). How Many Visitors Should Your Website Get? [Data from 400+ Web Traffic Analysts]. Retrieved from HubSpot
- Fortune Business Insights (2022). The global smart speaker market is projected to grow from $9.04 billion in 2021 to $34.24 billion in 2028 at a CAGR of 21.0% in forecast period, 2021-2028. Retrieved from Fortune Business Insights
- Gandhi, M. (2021). 2021 CTR Research Study. Retrieved from seoClarity
- Global Web Index (2020). Coronavirus Research | March 2020. GWI
- Google. (2022). Fun fact. Retrieved from Google
- google.com Traffic and Engagement Analysis. Retrieved from Similairweb
- Hardwick, J. (2023). SEO Pricing: How Much Does SEO Cost in 2023? [Industry Research]. Retrieved from Ahrefs
- HubSpot (2021). Not Another State of Marketing Report. Retrieved from HubSpot
- HubSpot (2020). Not Another State of Marketing Report. Retrieved from HubSpot
- Iskiev, M. (2022). The HubSpot Blog’s 2023 Marketing Strategy & Trends Report: Data from 1,200+ Global Marketers. Retrieved from HubSpot
- Laricchia, F. (2022). Smart speaker ownership worldwide 2020-2022, by country. Retrieved from Statista
- Lincoln, J.E. (2020). SEO and intent 2020: New study reveals true state of search. Retrieved from Ignite Visibility
- McCormick, K. (2022). Google Ads Cost Per Lead Has Increased for 91% of Industries YoY. Retrieved from WordStream
- Mobile vs. Desktop vs. Tablet Traffic Market Share. (2023) SimilairWeb
- Moser, J. (2022). The State of Backlinks for SEO in 2022: What 800+ SEOs Think About Link Building. Retrieved from uSERP
- National Public Media (2020). The smart audio report. Retrieved from NPR
- Ord, R. (2022). Amazon SEO is Now More Important than Google SEO for Brands. Retrieved from WebProNews
- Pecanek, M. (2020). How Often Does Google Rewrite Meta Descriptions? (New Data Study). Retrieved from Ahrefs
- Pecanek, M. (2020). 6 Important Insights About Title Tags (953,276 Pages Studied). Retrieved from Ahrefs
- Soulo, T. (2020). 90.63% of Content Gets No Traffic From Google. And How to Be in the Other 9.37% [New Research for 2020]. Retrieved from Ahrefs
- Soulo, T. (2020). Reciprocal Links: Will They Hurt Your SEO? (A Study by Ahrefs). Retrieved from Ahrefs
- Soulo, T. (2021). Long-tail Keywords: What They Are and How to Get Search Traffic From Them. Retrieved from Ahrefs
- Stox, P. (2022). Almost Half of GSC Clicks Go to Hidden Terms – A Study by Ahrefs. Retrieved from Ahrefs
- The Hybrid CX Advantage. (2021) Uberall
- Wiegand, B. (2022). Site Speed is (Still) Impacting Your Conversion Rate. Retrieved from Portent
- Video Marketing Statistics 2023. (2022) Retrieved from Wyzowl